• Skip to primary navigation
  • Skip to main content
  • Skip to primary sidebar
  • Skip to footer
  • About TronWeekly
  • Write for us
  • Terms and Conditions
  • Privacy Policy
  • Disclaimer
  • Contact
  • All Posts
  • Advertise

TronWeekly

Crypto World News

  • Home
  • Latest News
  • Opinion
    • Education
    • Best TRON Wallets
    • Beginner’s guide to TRON
    • Tron Tokens
    • Market Analysis
  • Industry
    • Tron Exchange
    • Project Review
  • Press Release
  • Bitcoin (BTC)
  • Ripple (XRP)
  • Advertise
  • About TronWeekly
    • The Team
    • Editorial Policy
    • Write for us
    • Privacy Policy
    • Disclaimer
    • Terms and Conditions
    • Contact
You are here: Home / All Posts

All Posts

Ethereum Price Struggles Below Key Resistance, Eyes Recovery Toward $2,200

By Zagham Abbas | Edited By Ammar Raza,May 22, 2026, 8:00 AM

Ethereum (ETH) price is weak after it continued trading below important resistance zones, though maintaining its position close to the significant support zone from which its future action can be determined.

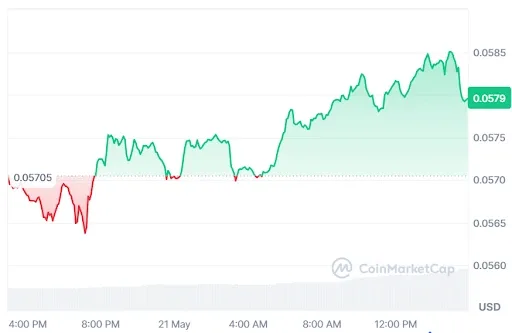
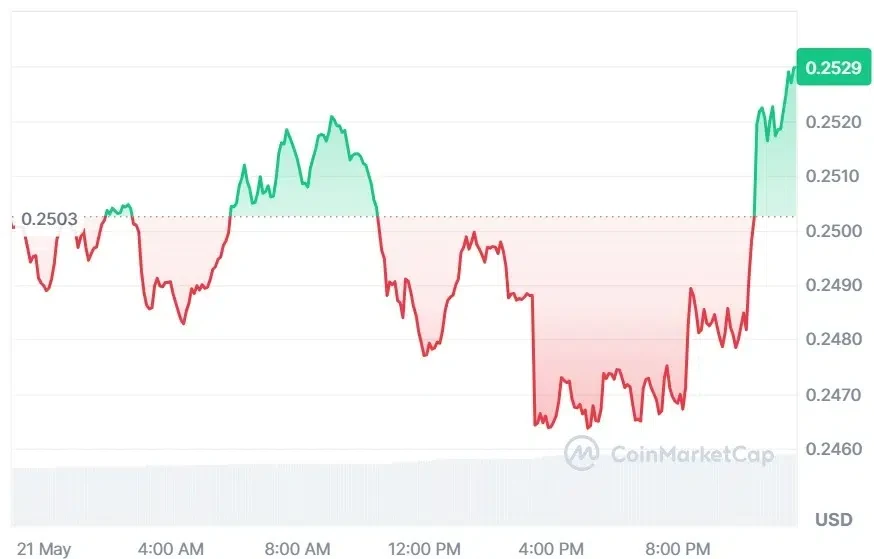
At the time of writing, ETH is trading at $2,130.02. The asset has recorded a 24-hour trading volume of $15.94 billion and a market capitalization of $257.10 billion. Over the last 24 hours, the Ethereum price has declined by 0.43%, reflecting continued selling pressure across the market.

Ethereum price chart

Source: CoinMarketCap

Also Read | Terra Collapse: Jane Street Accused of $192M UST Insider Exit

ETH Price Awaits Breakout Confirmation

On May 21, 2026, a popular crypto analyst, More Crypto Online, reported that the Ethereum price stays below an important resistance level from $2,156 to $2,200. This indicates that the market remains vulnerable to more declines in case the resistance holds.

ETH Price Awaits Breakout Confirmation

Source: More Crypto Online’s X Post

Meanwhile, the ETH price is now probing a critical support zone from which it can experience a corrective bounce in the short term. The ongoing setup is not out of a 1-2 setup towards the upside, though this will happen only on the condition that the Ethereum price manages to hold its support level, ranging from $2,066 to $2,099.

But then again, there is always risk involved. If the ETH price falls below the level of $2,040 with good momentum, it will be quite difficult for this trend to continue.

The key areas of support for Ethereum price are found at $2,099, $2,066, and $2,040, with resistance at $2,156 and $2,200. Unless the resistance level is breached, it would appear that the Ethereum.

Momentum Signals for Ethereum Price

Momentum oscillators are also indicating an ongoing downtrend in the price of Ethereum. The relative strength index (RSI) is down at 36.87 levels, which is below its average level of 44.00 and is inching towards oversold territory. This indicates that the sellers have become dominant in the market.

The ETH price is also currently trading below the 20-day simple moving average, valued at $2,258, and the 50-day simple moving average at $2,262, indicating that trend conditions remain unfavorable.
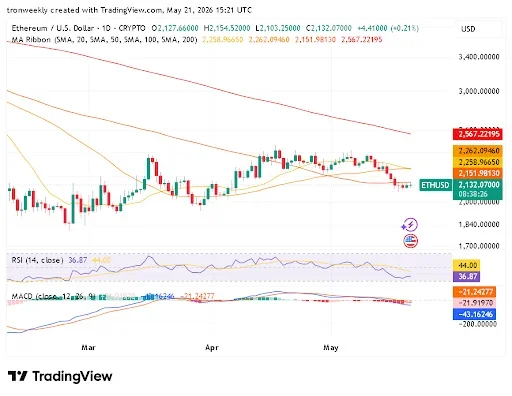
Momentum Signals for Ethereum Price

Source: TradingView

The MACD indicator remains bullish towards the Ether price trend. MACD is at -43.16 while the signal is at -21.24, with the MACD Histogram sitting at -21.91. This indicates continued downside momentum. The price of Ether may continue to find it tough unless it returns above $2,250-$2,260.

Overall, the ETH price is currently at a crucial support level; however, a break above resistance would be necessary for confirmation of an upturn.

This article contains market analysis and price predictions. These are not guarantees. Crypto markets are volatile. Always DYOR. Not financial advice.

Also Read | Crypto Scam: India Busts ₹226 Cr USDT Terror Network

Filed Under: Cryptocurrency News, Altcoin News

Hyperliquid Price Surges Toward Record High Amid Strong Momentum

By Zagham Abbas | Edited By Ammar Raza,May 22, 2026, 7:30 AM

Hyperliquid (HYPE) price is gaining momentum and making steady progress toward achieving its previous record high price as more people become interested in the token.

At the time of writing, HYPE is trading at $61.71, and the Hyperliquid price has surged 20.34% over the last 24 hours. The token has also recorded $3.79 billion in daily trading volume and a $15.59 billion market capitalization, reflecting increased participation across the market.

HYPE Price chart

Source: CoinMarketCap

Also Read | XRP Price Eyes $2 Breakout as CME Futures Volume Surges Past $62 Billion

Hyperliquid Price Moves Closer to Key Resistance Level

On May 21, 2026, cryptocurrency analytics company Alphractal revealed that they have been monitoring Hyperliquid for two months. The information provided by them reveals that the Hyperliquid price has crossed it’s all-time high of $59.30 achieved in September 2025.

The token then went into consolidation after peaking out. There was an uptick in action in April 2026, where perpetual volume topped $180 billion, and Hyperliquid took up 70% of on-chain perpetual trade volume. Hyperliquid token increased in value by 45% over five weeks, from $36 to $52.34.

Hyperliquid Price Moves Closer to Key Resistance Level

Source: Alphractal’s X Post

On May 18th, it was reported that CME Group and ICE were seeking regulation on Hyperliquid’s activities. This increased negative sentiment. At this time, two prominent liquidity providers withdrew their $100 million worth of BTC and ETH from the market.

Going against the anticipated trend of a weak price, the Hyperliquid price reversed its movement and gained 8.4% within the day. The gain in price over the next week was further seen to rise by 34%. The price remains just about 11.9% from hitting an all-time high.

On-chain Data Supports Hyperliquid Price Strength

On-chain metrics also suggest stable demand regardless of price swings. Whales increased their positions by $47 million, even as the funding rate came down from 0.08% to 0.02%. The open interest rebounded 18% in just 36 hours after the correction phase, and social volume saw a 4.3x spike above its average level.

These factors indicate that the price rebound for Hyperliquid is due to actual participation and not short-term speculation.

The token economy system has also become tighter due to token burnings. Buybacks account for 97% of the platform fees collected, and these are burned. To date, more than 41 million tokens have been burned, valued at over $1 billion.

Meanwhile, the system development goes on with the emergence of new products like HIP-4 events and prediction markets, all being launched amid regulatory talks. This development further buttresses the Hyperliquid price model.

Grayscale Accumulation Boosts Hyperliquid Momentum

According to Lookonchain data, Grayscale has made substantial gains. In particular, the company reportedly acquired 115,733 HYPE tokens worth approximately $6.65 million within an hour, and the total acquisition in a week amounted to 682,190 HYPE tokens worth roughly $34.9 million.

Grayscale Accumulation Boosts Hyperliquid Momentum

Source: Lookonchain’s X Post

Thus, this continuous stream of large buys has reinforced expectations for the Hyperliquid price trend.

This article contains market analysis and price predictions. These are not guarantees. Crypto markets are volatile. Always DYOR. Not financial advice.

Also Read | Kraken Expansion in UAE Secures VARA Approval for Full Crypto Services Rollout

Filed Under: Cryptocurrency News

Cardano NFT Trading Volume Jumps 434% in 2026

By Amrin Sanjay | Edited By Ammar Raza,May 22, 2026, 7:00 AM

Cardano’s NFT ecosystem has recorded a sharp increase in activity in 2026, with trading volume reportedly rising by 434% since the beginning of the year.

The latest figures, shared by staking platform Everstake using Artemis data, point to renewed interest in Cardano-based digital collectibles despite broader volatility in the crypto market. The surge has also sparked discussions about whether NFT activity is beginning to return across multiple blockchain networks.

Huge comeback for @Cardano NFT activity!

Trading volume has surged by over 434% since the beginning of the year, and the momentum is clearly building.

Beyond the headline numbers, this impressive rise reflects a deeper trend. Higher engagement typically brings increased wallet… pic.twitter.com/l2ySzZZq5F

— Everstake (@everstake_pool) May 21, 2026

Cardano NFT Market Shows Strong Recovery

The 434% increase in the volume of NFT transactions on the Cardano network represents one of its most robust phases of growth seen in a long time.

Activity had been declining significantly amid the decline in the entire crypto industry; however, the last few months seem to have indicated the revival of interest among traders and collectors. Increased wallet activity and transaction counts have also accompanied the rise in NFT volume.

Cardano NFT market shows strong recovery
Source: Artemis

Market observers say the recovery reflects improving engagement within the Cardano ecosystem rather than short-term speculation alone. NFT collections on the network have continued to attract communities focused on gaming, digital art, and utility-based assets. This broader participation may be helping sustain trading activity across marketplaces operating on ADA.

Also Read: Cardano Price Analysis: Will $0.255 Break Spark a Strong Recovery?

Growing User Participation Drives Network Activity

Increased NFT trade volume usually denotes higher interaction between various blockchain applications, and it seems like ADA is gaining from the trend. With an increase in the number of transactions involving NFT purchases, sales, and transfers, more transactions are made on the platform. This brings about increased need for wallets and marketplaces within the blockchain.

Analysts also point to user retention as a key factor behind the recent growth. Rather than relying only on new users entering the market, some existing participants appear to be returning to NFT trading after months of reduced activity. Continued engagement from established communities can help maintain consistent trading levels even during uncertain market conditions.

NFT Activity Expands Beyond Ethereum and Solana

Historically, Ethereum and Solana were the leaders in the NFT space; however, some of the recent tendencies point out that there might be a change in this situation.

In particular, the growth seen in the Cardano network shows that NFT ecosystems are evolving into being less centralized on specific blockchains. Lower transaction costs and community-driven projects have contributed to this shift.

Moreover, the rise in volume of Cardano NFTs is an indicator of changes in the preferences of those traders who seek other blockchain networks for transactions.

For example, some users might prefer blockchain networks that feature relatively low fees and lower congestion levels than those of bigger blockchains. In such circumstances, the development of ADA is expected to be one of the major NFT blockchains by 2026.

Also Read: Cardano RWA Expansion Sparks Bullish ADA Outlook Toward $0.27

Filed Under: Cardano (ADA), Altcoin News, Cryptocurrency News

Avalanche Price Holds Strong Above $9.35 as AVAX Expands Research

By Athulyamol VS | Edited By Ammar Raza,May 22, 2026, 6:30 AM

Avalanche price appears to have remained stable near a key resistance level as technical analysis, combined with a recent initiative undertaken by the Avalanche Foundation, has given rise to cautious optimism surrounding the network.

As a Layer-1 blockchain, Avalanche is focused on providing scalable decentralized applications and offering an institutional-quality blockchain infrastructure.

Avalanche Price Holds Near $9.35

The TradingView chart demonstrates that AVAX is still in a consolidating pattern, following an overall downtrend, with price now trading around the $9.35 area, as the token continues to get rejected against resistance in the $9.87 area.

This current price shows that a break above the $9.87 could provide further downside momentum for the short term.

The MACD (Moving Average Convergence Divergence) indicator indicates a slight bearish momentum as both of its signal lines are below neutral; however, the decreasing number of histogram bars indicates that downside momentum may be decreasing gradually.

In addition to the above indicators, the OBV (On-Balance Volume) indicator shows a slight upward trend even though the price has been moving sideways, indicating that some accumulation of AVAX has returned to the market.

Avalanche Price Holds Near $9.35
Source: TradingView

Also Read: Avalanche Stablecoin Partnerships Fuel Growth as AVAX Eyes $13.52 Level

Research Committee Update Boosts Avalanche Price Sentiment

A recent X post from the official Avalanche account also adds support to positive sentiment surrounding the network, as it states that “They’ve assembled a team”.

In addition to this, the Avalanche account introduced its research grant committee, which includes several economists, blockchain executives, and professors from institutions such as Duke, Columbia and the University of Florida.

They went on to say that these individuals are “Some of the most cited researchers in blockchain economics”.

Therefore, this initiative may continue to help strengthen Avalanche’s institutional and academic positions over time.

They’ve assembled a team.

The @AvalancheFDN has revealed a powerhouse selection committee for its upcoming research grant.

Economists, institutional investment leaders, blockchain execs, professors from Duke, Columbia, & UF.

Some of the most cited researchers in blockchain… https://t.co/roDPsyOv4N

— Avalanche🔺 (@avax) May 21, 2026

AVAX is continuing to trade in a consolidation structure while waiting to see if it can regain the resistance level of $9.87.

Short-term price action on the token will still likely be affected by the continuing volatility in the cryptocurrency industry and by the sentiment of the entire marketplace and trading action.

This article contains market analysis and price predictions. These are not guarantees. Crypto markets are volatile. Always DYOR. Not financial advice.

Also Read: Avalanche Price at $10.12 Surges Amid Avalanche Ecosystem Boom

Filed Under: Cryptocurrency News

ONDO Price Shows Accumulation Signals After 82% Crash: Is a $5 Rally Next?

By Sajjal Ali | Edited By Ammar Raza,May 22, 2026, 6:30 AM

Ondo Finance (ONDO) is showing signs of long-term accumulation after a major correction, with the ONDO price stabilizing in a strong demand zone and suggesting a possible structural shift. If momentum builds, it could recover prior highs and enter a broader bullish phase. Meanwhile, Ondo Finance is gaining traction in tokenized markets, reflecting rising interest in on-chain exposure to traditional assets.

At the time of writing, ONDO is trading at $0.4012 with a 24-hour trading volume of $287.95 million and a market capitalization of $1.96 billion. After posting the 5.66% gain over the last 24 hours, experts point to a strong bullish breakout for the ONDO.

ONDO current price

Source: CoinMarketCap

Also Read: ONDO Price Breakout Signals Strong Move After $2 Billion Surge in Market Cap

ONDO Price Accumulation Sparks Hope for $5 Rally

According to the crypto analyst Crypto Patel, the ONDO price has dropped nearly 82% from its all-time high of $2.15, spending over 17 months in correction. 

While sentiment faded and retail moved on, the ONDO price action has quietly stabilized. The $0.19–$0.24 zone continues to act as a strong demand area, suggesting accumulation rather than distribution during this extended period of market silence.

In the longer-term charts, ONDO seems to be indicating that a change in the overall structure has begun. Repeated support, Fibonacci convergence, and possible Wyckoff accumulation suggest that smart money has positioned itself before the attention gets back on things. 

If that scenario plays out, the ONDO price could see a transition from the accumulation stage to the markup stage.

ONDO price prediction

Source: Crypto Patel’s X Post

As long as the support holds strong, the ONDO price could go on to retest $1 before pushing higher towards its all-time high at $2.15 again, but within a larger wave where there is enough room to reach $5 and beyond. 

However, the breakdown of the key support on a higher time frame will take away all the bull setups. In cryptocurrency trading, price always comes first over anything else.

Ondo Drives $3.5B Tokenized Equity Growth on Binance

However, the data from Ondo Finance highlighted that the world market has seen a rapid shift to an on-chain movement because of the rise in tokenized shares. 

The reason for the fast adoption since the introduction of Ondo Finance on Binance three months ago lies in the increasing demand for US stock investment through blockchain technology.

Ondo Drives $3.5B Tokenized Equity Growth on Binance

Source: Ondo Finance’s X Post

Since its inception, the platform has attracted more than 170,000 users who have conducted transactions amounting to more than 600,000 and generating a total transaction volume of $3.5 billion. 

The use of Binance is growing to become a major hub for trading tokenized stocks, indicating a trend towards demand from investors seeking 24/7 availability and faster transaction processing.

This article contains market analysis and price predictions. These are not guarantees. Crypto markets are volatile. Always DYOR. Not financial advice.

Also Read: ONDO Price Outlook: Tokenized Stock Boom Could Drive Recovery Toward $0.85

Filed Under: Cryptocurrency News, Altcoin News

SUI Price Rises 6.50% as $0 Gas Fees and Strong Market Activity Drive Bullish Momentum

By Zagham Abbas | Edited By Ammar Raza,May 22, 2026, 6:15 AM

SUI price has been steadily increasing as the market’s interest level increases, both in spot and derivative markets. This is partly due to the fact that the platform has recently undergone a big change designed to eliminate any gas fees required to conduct transactions involving stablecoins, thus simplifying user payment methods. Besides improving its technical infrastructure, this is among the positive trends boosting its outlook in the short run.

At the time of writing, the SUI is trading at $1.14, marking a 6.50% gain over the last 24 hours. The SUI price action is supported by solid market activity, with trading volume reaching $1.29 billion and its market cap standing at $4.44 billion. This shows consistent attention from both spot and derivatives markets as momentum builds around the asset.

SUI Price chart

Source: CoinMarketCap

Also Read | Avalanche Stablecoin Partnerships Fuel Growth as AVAX Eyes $13.52 Level

SUI Price Gains After Major Upgrade

Analyst Ted noted the big change happening in the SUI ecosystem, the elimination of an important restriction on using cryptocurrencies. The transfer of stablecoins will be carried out for free, meaning that users can conduct transactions on the SUI platform without owning any tokens.

SUI Price Gains After Major Upgrade

Source: Ted’s X Post

Looking at the charts from a technical perspective, the SUI price has been able to rise back above its 20-day SMA, while RSI is continuing to climb. This indicates the presence of buying pressure in the existing setup. Provided the SUI price is supported between $1.05 to $1.07, it can potentially move higher once again.

SUI Price Momentum Builds Stronger

There is evidence that participation levels are improving in the market. Open interest is up 5.50% to $731.01 million, and the volume of trades has shot up to $1.40 billion, representing an increase of 91.87%. Such an increase usually coincides with a rise in momentum in the movement of the SUI price.

SUI Price Momentum Builds Stronger

Source: Coinglass

Additionally, there is evidence from funding figures supporting the slightly optimistic stance. The OI weighted funding level now stands at 0.0032%, indicating a slight bias towards longs. This demonstrates sustained faith in the near-term movement of the SUI price.

SUI Price Momentum Builds Stronger

Source: Coinglass

This article contains market analysis and price predictions. These are not guarantees. Crypto markets are volatile. Always DYOR. Not financial advice.

Also Read | Circle-Backed QCAD StableFX Enables Real-Time Institutional FX Settlement

Filed Under: Cryptocurrency News

INJ Price Targets $7 Rally as Triangle Pattern Signals Potential Breakout

By Mishal Ali | Edited By Ammar Raza,May 22, 2026, 6:00 AM

Injective (INJ) is forming a bullish triangle pattern with tightening price action and higher lows, indicating accumulation and improving momentum. Buyers are regaining control above key levels, and a breakout could follow for the INJ price if resistance is cleared. Injective also launched a policy institute to support clearer crypto regulation.

At the time of writing, INJ is trading at $5.19 with a 24-hour trading volume of $125.91 million and a market capitalization of $518.82 million. Following the 3.26% gain over the last 24 hours, the question is whether the INJ could maintain its momentum to reach new highs.

INJ current price

Source: CoinMarketCap

INJ Price Action Points to a Bullish Reversal to $7

According to the crypto analyst Tommy Swels, the INJ price chart is forming a clean bullish triangle pattern, signaling consolidation after recent volatility. 

The INJ price action is tightening as higher lows develop, suggesting accumulation beneath resistance. Market participants view this phase as a pause before a potential expansion move as momentum builds quietly within a narrowing trading range.

INJ price prediction

Source: Tommy Swels’ X Post

The primary focus remains on the $7 resistance level, which may prove to be the key event that leads to the breakout move for the INJ price. 

Amidst the overall bearish sentiment in the altcoins, a few players see this period as one that presents a favorable risk-reward ratio. In case a breakout occurs and holds, there is a strong possibility of the move reaching new heights.

Also Read: Injective Price Prediction: Bulls Eye 10x Rally Amid Strong Technical Setup

INJ Technical Indicators Point Bullish Momentum

According to TradingView, the INJ price is currently in an uptrend, peaking at just below $5.80 with strong support from both the 20 and 50 EMAs. 

This followed a dip that saw the INJ price fall towards the 100 EMA at $4.50. Recently, however, buyers have taken back control as the INJ price is now trading at $5.20, comfortably above all the EMAs.

INJ technical analysis

Source: TradingView

The MACD signals reversal of momentum. Initially, a fast rise in the INJ price caused a bullish crossover where green bars became wider and taller. 

As the retreat took place, a bearish reversal occurred when the MACD line crossed below the signal line. The two lines are now very near the zero point, rising up and indicating that bulls are gaining strength.

Injective Launches IPI to Advance U.S. Crypto Regulation

The data from Injective further highlighted that the company has launched the Injective Policy Institute (IPI), which is a focused arm aimed at advancing the development of on-chain finance in the US. 

The new development, which will be based in Washington D.C., aims at engaging directly with policymakers in order to shape the policies regarding blockchain developments and decentralization of finance in the mainstream policy circles.

Injective Launches IPI to Advance U.S. Crypto Regulation

Source: Injective’s X Post

The IPI will play the role of bridging decentralized technologies and existing policymaking, influencing its research and recommendations so as to enable sound regulation. 

In the wake of increased talk of regulating cryptocurrencies in the U.S., the institute’s mission is to encourage healthy discourse so that onchain finance can become more understandable and regulated.

This article contains market analysis and price predictions. These are not guarantees. Crypto markets are volatile. Always DYOR. Not financial advice.

Also Read: Injective (INJ) Price Prediction: Institutional Adoption Signals Breakout to $100

Filed Under: Cryptocurrency News, Altcoin News

DASH Price Prediction: Bulls Target $1010 as Bullish Trend Strengthens

By Usman Zafar | Edited By Ammar Raza,May 22, 2026, 5:30 AM

Dash (DASH) continues strong bullish momentum after a breakout, with higher lows and growing buying interest. The DASH price has pulled back after a recent peak, showing short-term cooling as indicators signal correction. Dash also develops username-based payments to improve usability and security.

At the time of writing, DASH is trading at $48.13 with a 24-hour trading volume of $251.55 million and a market capitalization of $611.25 million. Despite the signs of stability over the last 24 hours, experts point to a strong bullish breakout for the DASH amid improving technicals and strong network growth.

DASH Price chart

Source: CoinMarketCap

DASH Price Eyes $1010 as Bullish Breakout Gains Strength

According to the crypto analyst Javon Marks, the DASH price is extending its bullish momentum after gaining around 40% over the past month, drawing renewed attention from traders as a key breakout structure holds. 

The DASH price action shows strengthening demand, higher lows, and increasing participation, suggesting that sentiment is shifting back toward buyers as the asset stabilizes above previous resistance zones.

DASH Price Eyes $1010 as Bullish Breakout Gains Strength

Source: Javon Marks’ X Post

The market sentiments have become much more positive, with many experts considering a long-term target for the HYPE price around the $1010 level. 

This would mean an insane growth of about 1,700% from current levels. However, such expectations are possible only with continued momentum, an active cryptocurrency market as a whole, and constant accumulation.

Also Read: DASH Price Could Surge Toward $143 if Bulls Maintain Key Support Level

Technical Indicators Point to Upward Potential

According to TradingView, the DASH price managed to break away from an enclosed zone between $30.00 and $36.00 and moved towards a strong uptrend, touching a peak value near $56.00 in the month of May. Now, the DASH price is seen at $47.3850, representing a sharp fall of 6.54% on a daily basis.

Technical Indicators Point to Upward Potential

Source: TradingView

Bollinger Bands continue to be wide apart, reflecting continued volatility following the breakout. However, in the short term, the momentum is slowing, with the MACD line falling below the signal line while the histogram is going red. The bearish crossover indicates that the outlook remains positive on the macroscope.

Dash Builds Scammer-Resistant Crypto Identity System

The data from Dash further highlighted that Dash is forming an alternative payment model that involves human-friendly usernames instead of cryptic wallet addresses. 

This is because it will make crypto payments less error-prone, secure, and easy since one does not have to worry about typing the right address or being fooled into making mistakes when copying and pasting addresses.

Dash Builds Scammer-Resistant Crypto Identity System

Source: Dash’s X Post

The solution involves a fixed list of contacts to prevent spoofing attacks against verified usernames. Contacts will not be altered once entered, which will help prevent fraud from look-alike impostors. 

The idea behind this concept reflects the trend within the crypto world towards greater ease of use and, in effect, bringing blockchain-based transactions closer to instant messaging.

This article contains market analysis and price predictions. These are not guarantees. Crypto markets are volatile. Always DYOR. Not financial advice.

Also Read: DASH Price Accumulation Signals Potential Breakout Above 2021 High

Filed Under: Cryptocurrency News

MINA Price Holds Key Support as Bulls Eye Massive Rally Toward $3.50

By Usman Zafar | Edited By Ammar Raza,May 22, 2026, 5:00 AM

MINA is holding strong support within its descending channel, boosting bullish sentiment among traders. Technical indicators suggest weakening selling pressure and possible recovery momentum for the MINA price, while rising trading volume and open interest reflect growing investor confidence and expectations of continued market activity.

At the time of writing, MINA is trading at $0.05792 with a 24-hour trading volume of $5.06 million and a market capitalization of $74.55 million. Following the gain of 1.83% over the last 24 hours, now the question is whether MINA maintains its key support to keep the bullish trend intact.

MINA Price chart

Source: CoinMarketCap

MINA Price Holds Key Support as Bulls Target $3.50

Furthermore, the crypto analyst Jonathan Carter highlighted that the MINA price continues holding strong above the lower boundary of its descending channel on the weekly chart, signaling growing bullish confidence among traders. 

The support zone remains firmly defended, while the broader channel structure stays intact. Analysts believe this setup could become the foundation for a significant recovery if buyers maintain current momentum levels.

MINA Price Holds Key Support as Bulls Target $3.50

Source: Jonathan Carter’s X Post

A definitive bounce would take the MINA price higher to a number of resistance zones. The first resistance zone would be at $0.10 and then another one at $0.15 and finally $0.25. 

Above this, there are more significant macro resistance zones at $0.35, $0.55, and $1.00. In case this bullish trend continues, long-term predictions for the MINA price rallies to $1.70 and finally even $3.50.

Also Read: Altcoin Bull Run May Be Near as Bitcoin Dominance Faces Key Test

Technical Indicators Point to Improving Momentum

According to TradingView, the MINA price was riding an impressive upward trend until it reversed dramatically after reaching just a peak of $0.0760. 

In fact, the MINA price dropped below the 20-period moving average to reach nearly $0.0560. Currently, the Bollinger Bands are narrowing, meaning that the volatility level is low and MINA is trading within a consolidation pattern around $0.0580.

Technical Indicators Point to Improving Momentum

Source: TradingView

The MACD oscillators show the direction in which the momentum is moving. It can be observed that the initial spike gave rise to the formation of positive and green histogram bars. 

However, the bearish crossover drove it into the negatives on account of the MINA price decline. However, there is a little bullish crossover, with green bars coming into existence.

MINA Derivative Data Reveals a Bullish Outlook

However, MINA’s open interest slightly increased by 1.48%, rising to $9.64 million. The positive change indicates an increasing number of derivatives held by traders in the market, and this can be attributed to growing optimism among traders about more volatile periods ahead.

MINA Derivative Data Reveals a Bullish Outlook

Source: Coinglass

Trading volumes increased by 7.04% to $17.49 million, indicating an increasingly active market. This increase suggests that more participants are entering the fray, with improved liquidity and greater attentiveness on the part of traders to short-term price movements and general market sentiment.

This article contains market analysis and price predictions. These are not guarantees. Crypto markets are volatile. Always DYOR. Not financial advice.

Also Read: Bitcoin Dominance Holds 60% as Market Consolidates Near $1.61 Trillion

Filed Under: Cryptocurrency News, Altcoin News

ADA Price Shows $0.264 Recovery as TD Sequential Flashes Bullish Buy Signal

By Mishal Ali | Edited By Ammar Raza,May 22, 2026, 4:30 AM

Cardano (ADA) shows early recovery after a recent correction as technical indicators turn bullish and selling pressure fades for the ADA price. Momentum signals suggest a potential rebound if support holds, while infrastructure development proposals strengthen the long-term outlook, pointing to improving sentiment and a possible short-term reversal.

At the time of writing, ADA is trading at $0.2526 with a 24-hour trading volume of $422.77 million and a market capitalization of $9.16 billion. Following the 1.36% gain over the last 24 hours, ADA price structure and network growth point to a bullish breakout.

ADA current price

Source: CoinMarketCap

ADA Price Eyes Breakout as TD Sequential Turns Bullish

According to the crypto analyst Ali Charts, the ADA price may be showing early signs of recovery after a recent 15% correction over the past ten days. 

The TD Sequential indicator, which previously signaled the May 10 sell-off accurately, has now flashed a buy signal, suggesting that selling pressure is fading and a potential short-term bottom could be forming.

ADA price prediction

Source: Ali Charts’ X Post

If momentum strengthens, the ADA price could rise back up to $0.255, perhaps even breaking through up to $0.262. The positive scenario depends on the price staying above the important $0.246 level every day. Falling below that level could change the outlook in favor of the bearish trend.

Also Read: ADA Price Analysis: Elliott Wave Pattern Suggests Recovery Target at $0.349

Momentum Indicators Point to a Bullish Reversal

According to TradingView, the ADA price experiences structural reversal from a bullish move that reached highs of $0.2850 to a sharp correction period. 

Seller pressure pushed the ADA price towards a consolidation level at the $0.2450-$0.2500 level. However, a strong green candlestick indicates a short-term bullish move in the ADA price to $0.25291 levels.

ADA technical analysis

Source: TradingView

Technical signals have indicated a renewed drive once again. The RSI has shot up to 53.08, rising past its yellow line to shift the momentum to the buyers’ side. 

Simultaneously, the MACD indicator has given a bullish crossover below the zero line, which is accompanied by a green histogram as well, showing that bearish sentiment is losing some steam.

Cardano Targets Infrastructure Boost with ₳23M Proposal

The data from the Cardano Foundation further highlighted that the Cardano network has proposed the Critical Integrations V2 proposal on-chain that will help raise ₳23M for moving into the next stage of infrastructural development. 

This will include the costs for Year 2, maintenance, and improvements to core integrations with Circle, LayerZero, Pyth Network, Dune Analytics, and Fireblocks.

Derived from the Pentad model, the initiative is made possible through collaboration between Cardano Foundation, IOG, EMURGO, and Midnight Foundation under the guidance of Intersect. 

Its main objective is to enhance interoperability, institutional readiness, and sustainability of the burgeoning Cardano ecosystem.

This article contains market analysis and price predictions. These are not guarantees. Crypto markets are volatile. Always DYOR. Not financial advice.

Also Read: Cardano RWA Expansion Sparks Bullish ADA Outlook Toward $0.27

Filed Under: Cryptocurrency News, Cardano (ADA)

  • « Go to Previous Page
  • Page 1
  • Interim pages omitted …
  • Page 49
  • Page 50
  • Page 51
  • Page 52
  • Page 53
  • Interim pages omitted …
  • Page 3666
  • Go to Next Page »

Primary Sidebar

Recent Posts

  • ALGO Price Forecast: Can it Break Above $0.1319 Resistance? June 6, 2026
  • XRP Price Struggles at $1 Support While Bullish Cycle Targets Stay Locked at $5, $10 June 6, 2026
  • Galaxy Research Warns CLARITY Act Could Face Major Delays in 2026 June 6, 2026
  • Binance Coin Price Holds $570 as Resistance Triggers Market Uncertainty June 6, 2026
  • Professional Bitcoin Holdings Fall 17% as Hedge Funds Exit Positions June 6, 2026

Footer

News

  • Latest News
  • Altcoin News
  • Bitcoin (BTC)
  • Blockchain
  • Tron (TRX)
  • World

Digest

  • Meet the Founder
  • Price Winning Article
  • DeFi
  • Cyber Security
  • Crypto Scam

Industry

  • Project Review
  • Technology
  • Fintech
  • Tron Exchange
  • New in Town

Tron Universe

  • Event and Tron Parties
  • New in Town
  • Tron Tokens

FOLLOW US

  • Facebook
  • Telegram
  • Twitter
  • Linkedin

Subscribe US

Editorial Policy | Privacy Policy | Disclaimer | Terms and Conditions | Masthead

Copyright © 2026 · Tron Weekly. All Rights Reserved. NOTE: Tron Weekly is an independent crypto news site that adheres to the strict journalism policy anchored on transparency, trust, and objectivity, we have no affiliation with the TRON Foundation, its founder Justin Sun or any other cryptocurrency firm.