• Skip to primary navigation
  • Skip to main content
  • Skip to primary sidebar
  • Skip to footer
  • About us
  • Write for us
  • Terms and Conditions
  • Privacy Policy
  • Disclaimer
  • Contact
  • All Posts
  • Advertise

TronWeekly

Crypto World News

  • Home
  • Education
    • Best TRON Wallets
    • Beginner’s guide to TRON
  • Opinion
    • Tron Tokens
    • Market Analysis
  • Industry
    • Tron Exchange
    • Project Review
  • Press Release
  • Advertise
  • About us
    • The Team
    • Editorial Policy
    • Write for us
    • Privacy Policy
    • Disclaimer
    • Terms and Conditions
    • Contact
You are here: Home / Archives for Michael Fasogbon

Michael Fasogbon

Ripple Technical Analysis: XRP Poised For Bullish Swing But Suffers Volatility

November 30, 2019 by Michael Fasogbon

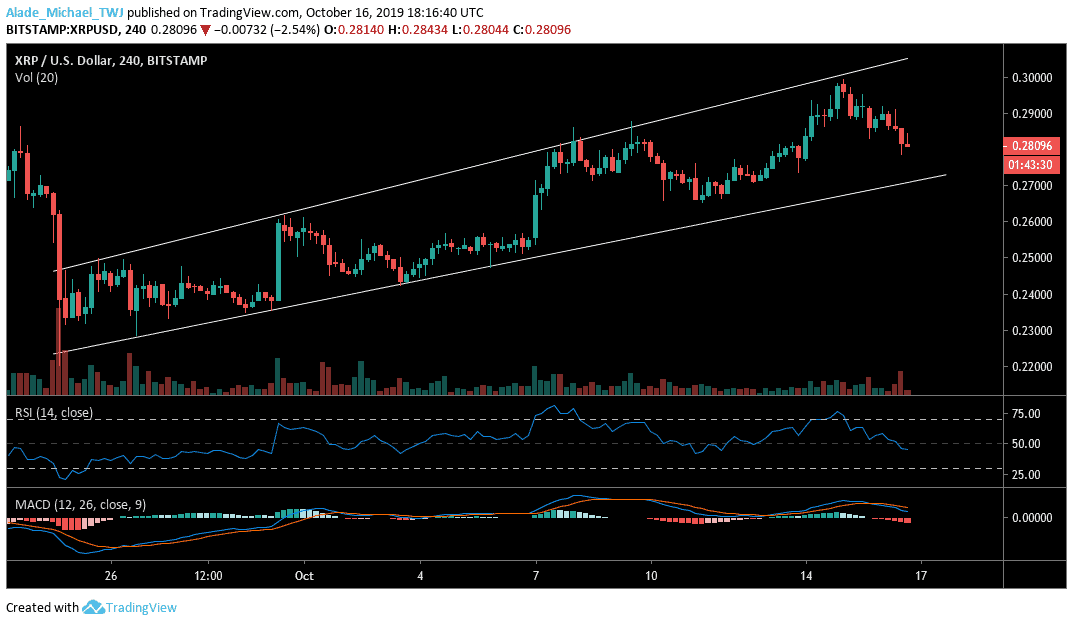
  • Ripple’s XRP is set for buying but facing a lot of weak liquidation for the past three days.
  • XRP is still following a long-term bearish sentiment, but it may come to an end if the bulls can reclaim $0.30 resistance.

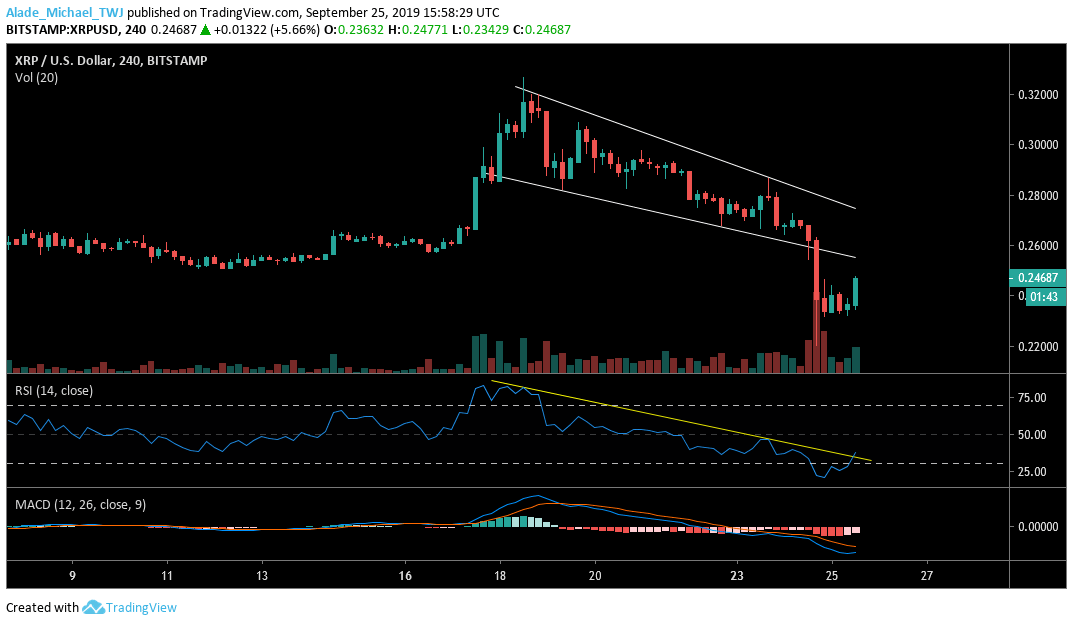
Following the weekly short opening that led Ripple’s XRP price to $0.2025, the third most-traded cryptocurrency is now floating at $0.23 after witnessing a quick bounce on November 25. Due to this effect, XRP is now sitting on a monthly low of $0.20. However, there’s a hope for the bulls to reclaim the $0.30 resistances if the demand is increasing.

Ripple’s Current Statistics

Trading Price: $0.22

Market Capitalization: $9,883,254,063

Trading Volume: $1,287,315,557

Ripple (XRP) Price Prediction for November 29, 2019

The daily chart for Ripple’s XRP shows an extension of the mid-year bearish actions in a channel. But considering the recent positive move in the market, XRP is forming a new bullish setup that is likely to shoot the price at $0.30 resistance levels in the coming days. Although, there’s near resistance at $0.25.

Most notably, XRP has tested the lower boundary of the channel on November 29 with a pin bar candle close – which has given bring a small growth to the XRP price. As we can see, the bullish setup is quite sluggish.

XRP technical price analysis chart
XRPUSD-Daily-Chart-November-29

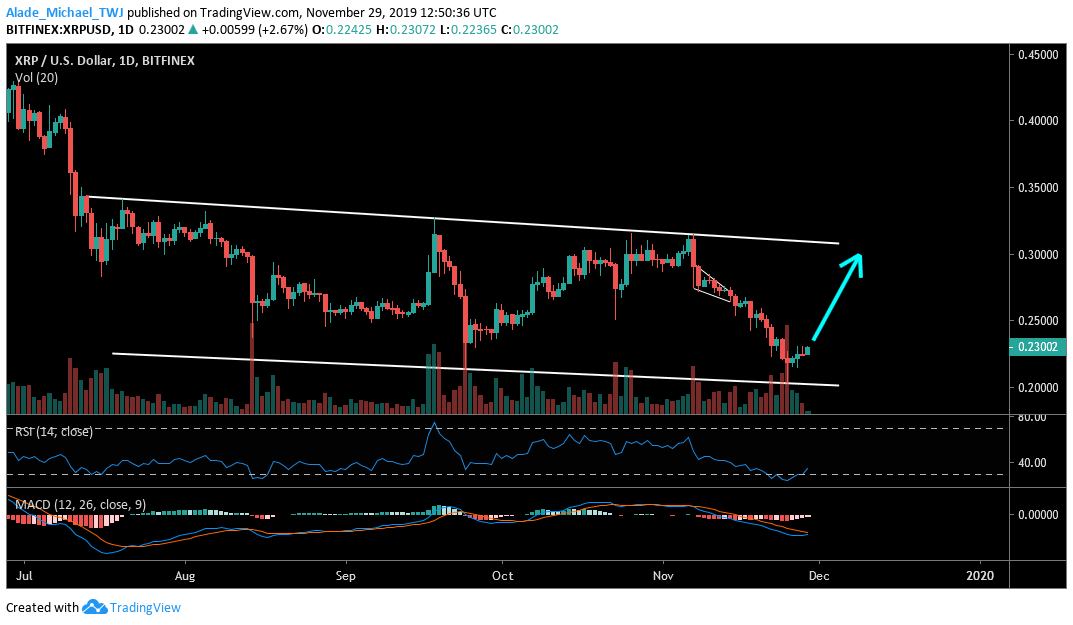
Well, this could be due to low buying pressure since the price bounced off the $0.20 support. There’s a tendency for a bearish continuation if the sellers step back in the market. A massive sell-off could roll the price of XRP below the channel as potential support lies at $0.18.

Conclusively

However, XRP may see a complete reversal if the buyers can push the price above the four-month channel pattern. But considering the current price actions, XRP is still struggling to leave the bearish zone. Technically, the intraday traders are still wary of the bearishness, but for swing traders, the future seems bright for Ripple’s XRP.

Technical Indicator Reading

The RSI for Ripple’s XRP is rising back due to the recent price increase in the market. More buying pressure is likely if RSI continues to climb.

The MACD for XRP is still in the negative zone, which still shows signs of weakness in the market.

Key Resistance Levels: $0.25, $0.30

Key Support Levels: $0.20, $0.18

Disclaimer: The presented information is subjected to market conditions and may include the very own opinion of the author. Please do your ‘very own’ market research before making any investment in cryptocurrencies. Neither the writer nor the publication (TronWeekly.com) holds any responsibility for your financial loss.

Never miss our daily cryptocurrency news, price analysis, tips, and stories. Join us on Telegram | Twitter or subscribe to our weekly Newsletter.

Filed Under: Market Analysis Tagged With: Price Analysis, Ripple (XRP)

Tron Price Analysis: Recent Price Break May Cause TRX to Fall Severely

October 17, 2019 by Michael Fasogbon

  • Tron broke out of the ascending channel pattern but may face short-term support at $0.0125.
  • The technical indicators confirm a bearish swing but may turn positive if the bulls can regroup strong.

On October 9, the price of the Tron peak at $0.0175 after witnessing a two weeks healthy correction. But now, the token has now recorded a current low around $0.0143 following the recent bearish actions. Over the past few hours, the TRX market has seen a little price push with +1.98% gains. Looking at the technical indicators, the sellers are now present in the market.

Tron’s Current Statistics

Trading Price: $0.0154

Market Capitalization: $1,020,396,207

Trading Volume: $640,140,983

Key Resistance Levels: $0.016, $0.017

Key Support Levels: $0.014, $0.0125

Tron Price Prediction for October 17, 2019

Tron’s price was rejected at $0.0175 last week, and now the market appeared to be reversing bearishly on the 4-hour time frame. Breaking out of the channel formation is another indicator of shorting the TRX/USD pair. The potential support to look out for now is the $0.014 and $0.0125 levels before we can confirm a bearish continuation.

Tron TRX technical price analysis chart
TRXUSD, 4H Price Chart – October 17, 2019

Meanwhile, the bulls are showing commitment as the market approaches the $0.016 resistance on a retracement move. A significant rise above the mentioned resistance could allow a further climb to $0.017 resistance, bringing the trade back inside the ascending channel pattern. Considering the recent price break-down, the TRX traders should continue shorting the market shortly.

Conclusively

In the next few hours, we should expect the bears to step back into the market, considering the October 9 reversal. But if the bulls can sustain the ongoing pressure above the $0.0175 resistance, we can expect a severe buying pressure to occur.  Meanwhile, the $0.0125 support remains a short-term bearish breakout for the TRX/USD pair.

Technical Indicator Reading

The RSI divergence shows that the bears are currently in play. We should keep an eye on the 30 level for a possible rebound or even a bullish crossover.

The Moving Average Convergence and Divergence (MACD) signals a bearish crossover for Tron (TRX) to show that the sellers have assumed control of the market.

Disclaimer: The presented information is subjected to market conditions and may include the very own opinion of the author. Please do your ‘very own’ market research before making any investment in cryptocurrencies. Neither the writer nor the publication (TronWeekly.com) holds any responsibility for your financial loss.

Never miss our daily cryptocurrency news, price analysis, tips, and stories. Join us on Telegram | Twitter or subscribe to our weekly Newsletter.

Filed Under: Market Analysis Tagged With: Price Analysis, TRON (TRX)

 Ripple (XRP) Price Meets Rejection at $0.30 as Rebounds Look Underway

October 16, 2019 by Michael Fasogbon

  • The XRP bulls meet resistance at $0.30, but the price may bounce back at $0.27 support.
  • Ripple’s XRP is now following an ascending broadening wedge formation as short-term bullish swing remains intact.

Ripple’s XRP has continued to see substantial growth following a bullish reversal on September 24. The last few days of price variations have made XRP to pullback at $0.30, although the market is still bullish in the short-term. Looking at the current price loss of -2.03%%, the third-largest cryptocurrency may continue its upward move if the $0.27 can continue to function as support.

Ripple’s Current Statistics

Trading Price: $0.281

Market Capitalization: $12,150,287,702

Trading Volume: $1,605,142,168

Key Resistance Levels: $0.29, $0.30

Key Support Levels: $0.27, $0.25

Ripple Price Prediction for October 16, 2019

On the 4-hour chart, Ripple’s XRP is following a bullish wedge formation but now pullback towards the wedge’s lower boundary. After dropping from $0.30 yesterday, the XRP price is now approaching the $0.27 support–which could provide a rebound level for the next bullish rally. Over the past three weeks now, the bearish impulsive move has been suspended.

Ripple XRP technical price analysis
XRPUSD-4H-Price-Chart-October-16-2019

Should the bears exhaust momentum around the mentioned support zones, a bullish continuation is expected to occur. However, we should keep an eye on the $0.29 and $0.30 before printing a new high. Nonetheless, the XRP bull are dictating the pace for now on a short-term but remains bearish on a long-term outlook

Conclusively

We should expect a quick buy once the trade reaches the wedge’s support at $0.27. And if the price fails to rebound, then a bearish breakout is likely to trigger more selling opportunity for traders – which might cause the price to retest the August low at $0.25.

Technical Indicator Reading

The RSI for Ripple’s XRP has turned bearish after reaching the overbought zone yesterday. We can expect XRP to resume bullish in the next couple of days or even hours.

The MACD shows that the Ripple (XRP) bulls are still present but now falling near the zero level to signal a slight bearish momentum. A bullish continuation is expected if the zero level can continue to sustain bullish pressure.

Disclaimer: The presented information is subjected to market conditions and may include the very own opinion of the author. Please do your ‘very own’ market research before making any investment in cryptocurrencies. Neither the writer nor the publication (TronWeekly.com) holds any responsibility for your financial loss.

Never miss our daily cryptocurrency news, price analysis, tips, and stories. Join us on Telegram | Twitter or subscribe to our weekly Newsletter.

Filed Under: Market Analysis Tagged With: Price Analysis, Ripple (XRP)

Bitcoin Price Consolidates After Creating New Support, Can $8000 Hold this Time?

September 26, 2019 by Michael Fasogbon

  • Bitcoin (BTC) is now relying on the $8000 support but may retest the $9000 resistance before dropping further.
  • Bitcoin’s price shapes in a new descending channel after breaking out of the triangle patterns.

After breaking the $9000 essential support on September 24, Bitcoin found support at $8000, followed by a quick rebound to $8400 – where BTC is now trading at. Up till now, the market has since remained in a consolidation mode, deciding on the next actual move.

However, we can expect the market to continue to sell as soon as the bears regroup. In case the bulls show strong commitment, Bitcoin may climb back to the critical resistance levels.

Bitcoin’s Current Statistics

Trading Price: $8146

Market Capitalization: $152,087,730,129

Trading Volume: $17,455,199,628

Key resistance levels: $8600, $8800, $9000

Key support levels: $8000, $7526, $7000

Bitcoin Price Prediction for September 26, 2019

The September 24 sudden shock-wave has made Bitcoin’s price to bottom at $8000, breaking the symmetrical triangle at $10000 and the important descending triangle at $9000 – which was forming for the past months. The bearish scenario has now brought Bitcoin in a new descending channel pattern – which may lead price to the $6000 zone in the next bearish run.

Bitcoin BTC technical analysis chart
BTCUSD, Daily Price Chart – September 26, 2019

While BTC/USD pair consolidates at around $8400 for two days, the price may fall back at the $8000 holding support before slipping further to $7526 support – the June low. Driving beneath this support could plummet price at $7000 support and beyond. On the other hand, a quick retracement may allow the price to retest the $8600, $8800, and $9000 resistance. Still, Bitcoin remains bearish at the moment.

Conclusively

This might just be the beginning of the drops for Bitcoin considering the newly descending channel formation on the daily chart. We may see a more severe decline in the next couple of days if the bearish trend continues to shape in a pattern formation. And if Bitcoin shows strength, the important level of $9000 may be revisited.

Technical Indicator Reading

RSI for Bitcoin price is hugely in the oversold territory following the recent $1600 price cut. A possible bullish may play out if the indicator can turn positive.

MACD is still reflecting an ongoing bearish action in the market as Bitcoin remains in the negative zone. A positive cross should provide a buying opportunity.

Disclaimer: The presented information is subjected to market condition and may include the very own opinion of the author. Please do your ‘very own’ market research before making any investment in cryptocurrencies. Neither the writer nor the publication (TronWeekly.com) holds any responsibility for your financial loss.

Never miss our daily cryptocurrency news, price analysis, tips, and stories. Join us on Telegram | Twitter or subscribe to our weekly Newsletter.

Filed Under: Market Analysis Tagged With: Bitcoin (BTC), Price Analysis

Stellar Price Analysis: XLM Secures $0.05 Support to Boost Bullish Momentum

September 26, 2019 by Michael Fasogbon

  • Stellar (XLM) now held the $0.05 as support level as the market correct to previous resistance.
  • The XLM/USD pair has seen a slight break above the upper boundary of the channel.

Following the latest price variations, Stellar’s price has seen a significant price increase over the past few hours with current support held at $0.05 level. On September 24, the XLM/USD pair a fall below the $0.058 levels – which acted as support-turned -resistance for the market.

The bulls are now turning active as they gain slowly gain control of the market. While remaining as the 10th largest cryptocurrency, XLM is rising back with a current price gain of +4.29% (as we write this, the rest of the significant cryptocurrencies are in red, including Bitcoin).

Stellar’s Current Statistics

Trading Price: $0.057

Market Capitalization: $1,200,297,968

Trading Volume: $259,093,317

Key Resistance Levels: $0.065, $0.070. $0.075

Key Support Levels: $0.055, $0.050, $0.045

Stellar Price Analysis for September 26, 2019

After establishing support at $0.050, Stellar Lumen is now breaking-up out of the descending channel pattern on the 2-hour time frame – which shows that the market is following a bullish sentiment. A close look at the chart revealed that the buyers are regrouping well at $0.065, $0.070, and $0.075 resistance levels.

Stellar XLM technical price analysis chart
XLMUSD, 2H Price Chart – September 26, 2019

However, if the market pulls back, we can expect close support at $0.060, where the price recently broke out. The $0.050 and $0.045 support may come into play if the price falls back inside the channel formation. Regardless of the above analysis, the Stellar market is still looking bearish on the daily chart.

Conclusively                                                                                                                 

Now that the bulls are gaining control of the market, XRP may continue to go long in the next few days if the buyers keep regrouping well in the market. Otherwise, the market may resume the short-term downtrend. However, trading volume is now increasing as volatility now becomes revealing with choppy price actions.

Technical Indicator Reading

RSI is now climbing back to show the current positive move in the market – now breaking above the mid-band to confirm the bulls are back in the market.

MACD moving average for Stellar (XLM) has crossed up in the negative zone but may turn positive if the buying pressure becomes enormous.

Disclaimer: The presented information is subjected to market condition and may include the very own opinion of the author. Please do your ‘very own’ market research before making any investment in cryptocurrencies. Neither the writer nor the publication (TronWeekly.com) holds any responsibility for your financial loss.

Never miss our daily cryptocurrency news, price analysis, tips, and stories. Join us on Telegram | Twitter or subscribe to our weekly Newsletter.

Filed Under: Market Analysis Tagged With: Price Analysis, Stellar (XLM)

Ripple (XRP) Price Gets Captured in a Descending Wedge Pattern

September 26, 2019 by Michael Fasogbon

Despite the current rise, the $0.25 resistance appears to be a severe level for the native cryptocurrency of Ripple, XRP, to surpass over the past 24-hours.

Ripple’s XRP is running out of momentum in the four-month descending wedge pattern. The price of Ripple’s XRP is bouncing back again following the last 24-hours price increase of 4.17%. The XRP bulls are walking into the market amidst the mid-year bearish scenario – which is still quite dominant.

Meanwhile, the September 24 shock-waves is still alive in the market as traders tend to panic because of FUD – fear uncertainty and doubt. All in all, the bulls may need to clear the $0.25 price levels before we can have an excellent buying opportunity.

Ripple (XRP)’s Current Statistics

Trading Price: $0.248

Market Capitalization: $10,688,773,015

Trading Volume: $1,415,861,153

Key Resistance Levels: $0.27, $0.28, $0.293, $0.313

Key Support Levels: $0.23, $0.22, $0.21, $0.20

Ripple Price Prediction for September 26, 2019

On the daily chart, Ripple’s XRP is reaching a tight angle on the wedge pattern that has been forming over the past months. After recording monthly high at $0.326, the price of XRP has found a new low at $0.22 – which is currently reinforcing the current price growth. While facing a tough level at $0.25, the market could spike to $0.27, $0.28, $0.293 before breaking the wedge to $0.313 resistance.

Ripple XRP technical price analysis chart
XRPUSD, Daily Price Chart – September 26, 2019

As of now, traders are yet to show a strong commitment to buying. Should the buyers turn weak now, we can expect the market to roll back at the $0.23 and $0.22 support zone. The $0.21 and $0.20 level may further produce support for the market if breach beneath the support zones fails to contain next bear rally. Whichever way, the XRP/USD pair continues to remain in a downward range.

Conclusively

Considering the latest price variations, the volume is trooping into the market as possible climb may play out if the demand keeps increasing. Should such a scenario occurs, Ripple’s XRP could break away from the falling wedge pattern sooner or later.

Technical Indicator Reading

RSI for Ripple’s XRP has sharply dropped back to the bear zone as a result of the recent massive sell in the market.

MACD is swinging back in the negative zone after witnessing a slight cross above the zero level. We may further see a bullish momentum if the oscillator turns positive.

Disclaimer: The presented information is subjected to market condition and may include the very own opinion of the author. Please do your ‘very own’ market research before making any investment in cryptocurrencies. Neither the writer nor the publication (TronWeekly.com) holds any responsibility for your financial loss.

Never miss our daily cryptocurrency news, price analysis, tips, and stories. Join us on Telegram | Twitter or subscribe to our weekly Newsletter.

Filed Under: Market Analysis Tagged With: Price Analysis, Ripple (XRP)

Bullish Ripple RSI Crossover Signals Price Correction for XRP

September 25, 2019 by Michael Fasogbon

  • Ripple (XRP) is attempting to retrace back to the break level, but the buyers’ commitment is still low.
  • XRP is still looking bearish, although the RSI indicator has just signaled a bullish move.

After witnessing a massive drop during yesterday’s trading, Ripple (XRP) is now trading beneath the $0.25 price level which has held the market since mid-August. Following the latest price action, XRP trading is currently pinned on new support at $0.23 level. The XRP/USD pair has recovered a bit but is still down by -6.13%; suggesting that the sellers are still much dominant in the market. We can expect more price drop in the next few days.

Ripple (XRP)’s Current Statistics

Trading Price: $0.245

Market Capitalization: $10,605,409,219

Trading Volume: $2,482,904,725

Key Resistance Levels: $0.25, $0.26

Key Support Levels: $0.23, $0.22

Ripple Price Prediction for September 25, 2019

On the 4-hour chart, XRP is looking for a retracement level at the $0.25 – $0.26 support areas that hugely got broken. The bearish trend now becomes more significant following the latest price action. Ripple’s XRP is more likely to meet rejection after testing the above supports, where the wedge’s lower boundary lies.

Ripple XRP technical price analysis chart
XRPUSD, 4H Price Chart – September 25, 2019

If the market eventually resumes sell-off now, the market will find immediate support at $0.23 and $0.22 – the currently monthly low before we can consider a further dip. However, the XRP/USD pair has continued to erode bearishly on the daily time frame. A bullish rally will only confirm if the market can climb significantly back above the $0.30.

Conclusively

Having slumped beneath the $0.25, Ripple’s XRP will continue to show weakness in price and fall at support until the market can find a stable level to reinforce bullish run. For now, a new low is yet to be ascertained as the bears remain dominant and active over the past days. We may need to wait for the sellers to exhaust momentum before longing. However, shorting XRP might be the best position for now.

Technical Indicator Reading

RSI has produced a bullish crossover signal, and as we can see, Ripple (XRP) is breaking up the diagonal resistance line (yellow) to show that the market is buying at the moment.

MACD moving averages are still swinging in the negative zone to reveal that the bearish trend is still intact. We can expect a definite buy if the market climbs above the zero level.

Disclaimer: The presented information is subjected to market condition and may include the very own opinion of the author. Please do your ‘very own’ market research before making any investment in cryptocurrencies. Neither the writer nor the publication (TronWeekly.com) holds any responsibility for your financial loss.

Never miss our daily cryptocurrency news, price analysis, tips, and stories. Join us on Telegram | Twitter or subscribe to our weekly Newsletter.

Filed Under: Market Analysis Tagged With: Price Analysis, Ripple (XRP)

Tron (TRX) Loses -21.05% Under 24-hours Following Recent Massive Sell-off

September 24, 2019 by Michael Fasogbon

  • Tron (TRX) is now trading below the two weeks ascending channel pattern, facing a key support level at $0.01.
  • The technical indicators reflect a strong bearish trend owing to the current sudden bear surge.

The recent sell-off has made the price of Tron to plunge drastically from $0.17 to $0.117, amounting to a price change of -21.05% a few hours ago. In fact, the technical indicators have similarly fallen to their lowest levels as the trend turns out in favor of the bears. As of now, TRX is falling as the market looks for nearby support to contain the current massive drops. However, the $0.01 zone could provide support for the market if the selling pressure continues.

Tron’s Current Statistics

Trading Price: $0.0127

Market Capitalization: $853,336,632

Trading Volume: $720,825,286

Key Resistance Levels: $0.014, $0.016

Key Support Levels: $0.012, $0.01 

Tron Price Prediction for September 24, 2019

Following the ongoing down-surge, the TRX/USD pair has successfully broken the ascending channel pattern to the downside, now approaching near support at $0.010. Meanwhile, the token is currently trading a $0.0127 price level. Now, the price action is eroding bearishly on the 4-hour time frame after a huge sell-off.

TRXUSD 4H Price Chart September 24 2019 1

If the $0.012 can act as a support level, the price of Tron may retest previous resistance at $0.014 and $0.016. As of now, there’s no sign for a bullish move. The primary support for this market lies at $0.01 level. On the long-term perspective, TRX is still suggested to be following a bearish sentiment.

Conclusively

As long as the sellers continue to release pressure in the market, we can expect the TRX/USD pair to remain in a downward range. On the other hand, if the bulls can regroup back, we may see a trend reversal. But as it stands now, Tron is showing an intense weakness as the market falls.

Technical Indicator Reading

The RSI has now dropped below the 30 level after witnessing a colossal Tron price reduction over the last few days.

The MACD has switched back beneath the zero level following the recent channel break down at $0.017.

Disclaimer: The presented information is subjected to market condition and may include the very own opinion of the author. Please do your ‘very own’ market research before making any investment in cryptocurrencies. Neither the writer nor the publication (TronWeekly.com) holds any responsibility for your financial loss.

Never miss our daily cryptocurrency news, price analysis, tips, and stories. Join us on Telegram | Twitter or subscribe to our weekly Newsletter.

Filed Under: Market Analysis Tagged With: Price Analysis, TRON (TRX)

Ripple (XRP) Price Seriously Corrects Loss Beneath the September Low

September 24, 2019 by Michael Fasogbon

  • The price of Ripple’s XRP tumbled sharply to a new support level after witnessing a sudden bearish surge.
  • The XRP/USD pair has plunged beneath the descending wedge pattern – indicating a major bearish correction in the market.

Over the past six days now, Ripple’s XRP price has continued to meltdown steadily and has now rolled over to a new monthly low at $0.22 after seeing a massive shockwave that hit the market just a few hours ago.

The bearish scenario is eroding against the Bitcoin pair. In overall, the price of native Ripple cryptocurrency has currently lost -11.47%, causing the bear to dominate the market. Still, XRP remains the 3rd most-traded cryptocurrency behind Ethereum and Bitcoin that have similarly witnessed a massive sell-off.

Ripple (XRP)’s Current Statistics

Trading Price: $0.24

Market Capitalization: $10,359,437,106

Trading Volume: $2,154,747,117

Key Resistance Levels: $0.25, $0.26

Key Support Levels: $0.22, $0.20

Ripple Price Prediction September 24, 2019

Zooming into the 2-hour chart, Ripple’s XRP had slump beneath the descending wedge pattern over the past three hours. Currently, the price is testing the $0.24 zone following the recent sharp drop. However, the market is likely to bounce higher to $0.025 and $0.26 resistance levels, where the wedge’s lower boundary lies before the next rally resurfaces.

Ripple XRP technical price analysis chart
XRPUSD, 2H Price Chart – September 24, 2019.

If the XRP/USD pair drives lower, the price may slip to at $0.22. However, the $0.20 may further act as support if the supply becomes heavier. As we can see from the chart, the volume is quite impressive over the past seven days – reflecting the significant trading activity. Nevertheless, Ripple’s XRP is eroding bearishly on a long-term perspective.

Conclusively

Ripple (XRP) may face severe price drops in the coming days if the $0.20 support fails to suppress the ongoing selling pressure in the market. But if the previously mentioned support can hold well, we should expect a sharp rebound towards the $0.30 – which could lead to a bullish reversal formation.

Technical Indicator Reading

The RSI had been trending in a downward direction since the trend reversed at the overbought area, although Ripple’s XRP is now in the oversold zone.

The MACD has swung back in the negative zone following the past few hours of severe drops – suggesting a bearish action in the market.

Disclaimer: The presented information is subjected to market condition and may include the very own opinion of the author. Please do your ‘very own’ market research before making any investment in cryptocurrencies. Neither the writer nor the publication (TronWeekly.com) holds any responsibility for your financial loss.

Never miss our daily cryptocurrency news, price analysis, tips, and stories. Join us on Telegram | Twitter or subscribe to our weekly Newsletter.

Filed Under: Market Analysis Tagged With: Price Analysis, Ripple (XRP)

Ripple (XRP) Shows Strength after Five Days of Retracement

September 23, 2019 by Michael Fasogbon

  • Ripple (XRP) broke out of the five days descending wedge pattern with a 2.59% price increase.
  • The XRP/USD pair may visit previous resistance if the bulls continue to power the momentum.

Ripple’s XRP is now showing strength after meeting the $0.28, and $0.27 supports we predicted in our previous Ripple’s XRP analysis. The price of XRP is now up by +2.59% as the cryptocurrency appeared to be witnessing an intense buying pressure in the last 3-hours of trading. As the bulls step back in the market, we can expect significant price growth in the next few days.

Ripple’s Current Statistics

Trading Price: $0.285

Market Capitalization: $12,292,600,487

Trading Volume: $1,301,984,031

Key Resistance Levels: $0.30, $0.31, $0.32

Key Support Levels: $0.28, $0.27, $26

Ripple Price Prediction for September 23, 2019

Ripple’s (XRP) has seen a five-day decent retracement move with a descending wedge pattern which is now broken to the upside after creating support at the $0.266. Following the recent bullish breakout, the price is likely to surge at $0.30, $0.31 and $0.32 resistance.

Ripple XRP technical price analysis chart
XRPUSD, 1H Price Chart – September 23, 2019

However, the market is likely to retest the $0.28 and $0.27 support before we can validate a proper bullish momentum. The $0.26 support may further suppress selling pressure. From a technical standpoint, the XRP/USD pair is rising back with a more price increase is likely to play out.

Conclusively

Following the last 3-hours surge in volatility that led to a significant rise in the market along with a wedge break-up, we can expect the price of Ripple’s XRP to swing higher until the market turns weak. Nevertheless, we may see a slight drop to previous support before continuing a bull-run.

Technical Indicator Reading

RSI for Ripple’s XRP is now testing the upper band, which seems sturdy for the short-term bull to overcome. A cross to the overbought area may bring more rises in the market.

MACD is attempting to climb above the zero level, although the native cryptocurrency of Ripple is still struggling in the negative zone. A crossover should confirm a robust bullish move for the market.

Disclaimer: The presented information is subjected to market condition and may include the very own opinion of the author. Please do your ‘very own’ market research before making any investment in cryptocurrencies. Neither the writer nor the publication (TronWeekly.com) holds any responsibility for your financial loss.

Never miss our daily cryptocurrency news, price analysis, tips, and stories. Join us on Telegram | Twitter or subscribe to our weekly Newsletter.

Filed Under: Market Analysis Tagged With: Price Analysis, Ripple (XRP)

  • Go to page 1
  • Go to page 2
  • Go to page 3
  • Interim pages omitted …
  • Go to page 12
  • Go to Next Page »

Primary Sidebar

Recent Posts

  • Shiba Inu L2 Docs Reveal More Details March 28, 2023
  • Bitcoin, Ethereum Enabled In Burger King Paris: Details March 28, 2023
  • Nvidia’s CTO Skeptical Of Crypto’s Value, Believes AI Is The Future March 28, 2023
  • TRON Founder’s Hong Kong Expansion Plan In Jeopardy? March 28, 2023
  • Binance’s New Blockchain Hub In Georgia: Web3 Education & Job Opportunities  March 28, 2023

Footer

News

  • Altcoin News
  • Bitcoin News
  • Blockchain
  • Tron News
  • World

Digest

  • Meet the Founder
  • Price Winning Article
  • DeFi
  • Cyber Security
  • Crypto Scam

Industry

  • Project Review
  • Technology
  • Fintech
  • Tron Exchange
  • New in Town

Tron Universe

  • Event and Tron Parties
  • New in Town
  • Tron Tokens

Follow Us

Subscribe US

Copyright © 2023 · Tron Weekly. All Rights Reserved. NOTE: Tron Weekly is an independent crypto news site that adheres to the strict journalism policy anchored on transparency, trust, and objectivity, we have no affiliation with the TRON Foundation, its founder Justin Sun or any other cryptocurrency firm.