• Skip to primary navigation
  • Skip to main content
  • Skip to primary sidebar
  • Skip to footer

TronWeekly

Crypto World News

  • Home
  • Education
    • Best TRON Wallets
    • Beginner’s guide to TRON
  • Opinion
    • Tron Tokens
    • Market Analysis
  • Industry
    • Tron Exchange
    • Project Review
  • Press Release
  • Advertise
  • About us
    • The Team
    • Editorial Policy
    • Write for us
    • Privacy Policy
    • Disclaimer
    • Terms and Conditions
    • Contact
You are here: Home / News / Altcoin News / Binance Coin [BNB] Tries To Make Its Way Back To $600; Will The Bears Allow This Surge?
Binance Coin

Binance Coin [BNB] Tries To Make Its Way Back To $600; Will The Bears Allow This Surge?

April 21, 2021 by Sahana Kiran

Except for Dogecoin [DOGE], every crypto in the market was on an upward trajectory. Binance Coin [BNB], however, was leading this movement. Bitcoin [BTC] was finally getting back on track as it recorded some green in the red zone. At press time, BTC was trading at $55K with a 1.72% rise in the last 24-hours. This seemed to have caused the rise in the altcoin takeover. ETH’s dominance grew to 13% while BTC slumped to 50%.

Binance Coin, during the time of writing, was trading for $593.99 with a whopping 19.07% increase in the last 24-hours. Just a couple of days ago, BNB rose over $600 and recorded an all-time high of $637.44. Additionally, the altcoin climbed up the crypto ladder and took over the third spot. The market cap of the asset was noted at $90.34 billion which further pushed the total market cap to $2.04 trillion.

Binance Coin [BNB] One-Hour Price Chart

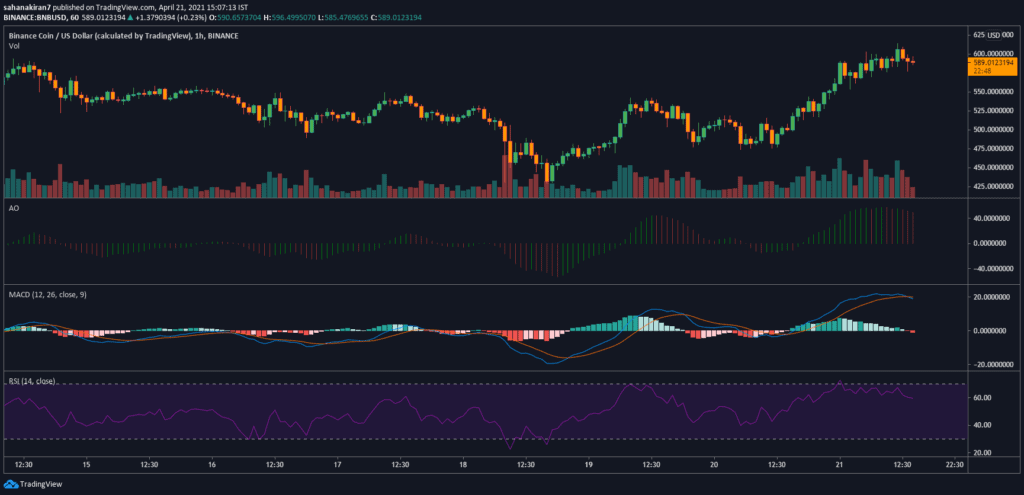
The short-term price chart of BNB was noted harboring the bears. The Awesome Oscillator indicator rolled out red closing bars which further suggested a bearish momentum. The signal line was once again trailing back over the MACD line. This, in turn, formed a bearish crossover. While both the key indicator used in the one-hour price chart of CZ’s coin was noting the presence of bears, the altcoin’s chances of moving past $600 could be hindered.

Additionally, the Relative Strength Index indicator was noted in the buyers’ zone, despite the ongoing bear market.

Binance Coin [BNB] One-Day Price Chart

Binance Coin

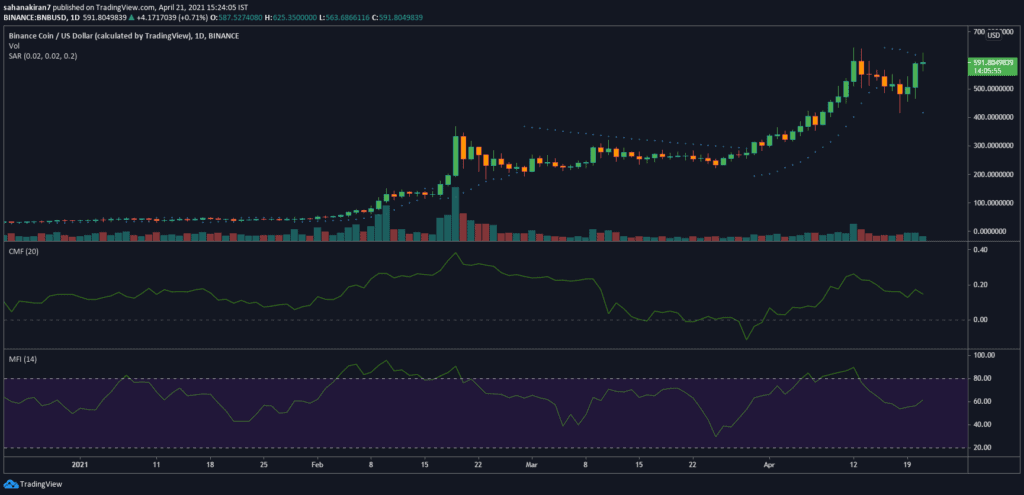
The one-day price chart of BNB was riding the bull. The Parabolic SAR indicator was reversing the bearish trend that had struck the BNB market. The indicator started forming dotted lines below the candlesticks further limiting the chances of a downtrend. The Chaikin Money Flow indicator was exerting a bullish momentum as it was over the zero median.

A buyers’ sentiment was noted in the BNB market as the Money Flow Index indicator was in the buyers’ zone.

Filed Under: Altcoin News, Market Analysis Tagged With: Binance Coin (BNB)

Primary Sidebar

Recent Posts

  • Crypto Defies Traditional Markets: Steady As Fed Keeps Interest Rates Unchanged September 22, 2023
  • South Korea’s $98.3 Billion Crypto Asset Frenzy Takes Center Stage: Report September 22, 2023
  • Tether’s Bold Gamble: Revives Stablecoin Loan Despite Earlier Pledge September 22, 2023
  • OnlyFans’ Loss, Only1’s Gain: The Web3 Platform Wooing Creators September 22, 2023
  • South Korea Spearhead a City-Wide Blockchain Mainnet To Foster Digital Innovation September 22, 2023

Footer

News

  • Altcoin News
  • Bitcoin News
  • Blockchain
  • Tron News
  • World

Digest

  • Meet the Founder
  • Price Winning Article
  • DeFi
  • Cyber Security
  • Crypto Scam

Industry

  • Project Review
  • Technology
  • Fintech
  • Tron Exchange
  • New in Town

Tron Universe

  • Event and Tron Parties
  • New in Town
  • Tron Tokens

Follow Us

Subscribe US

Copyright © 2023 · Tron Weekly. All Rights Reserved. NOTE: Tron Weekly is an independent crypto news site that adheres to the strict journalism policy anchored on transparency, trust, and objectivity, we have no affiliation with the TRON Foundation, its founder Justin Sun or any other cryptocurrency firm.