
After weeks of enticing a move above the resistance of $12,000, Bitcoin has finally fallen prey to enormous bearish pressure from the top. On 1st September, Bitcoin first exhibited a rally above $12,000 but within a 12-hour period, the digital asset shed over $1000 dollars in the charts.
Suddenly from being extremely bullish, concerns have started to arise about Bitcoin’s immediate future. We analyzed the current markets and with respect to the collective market trend, the current low might sustain for a while.
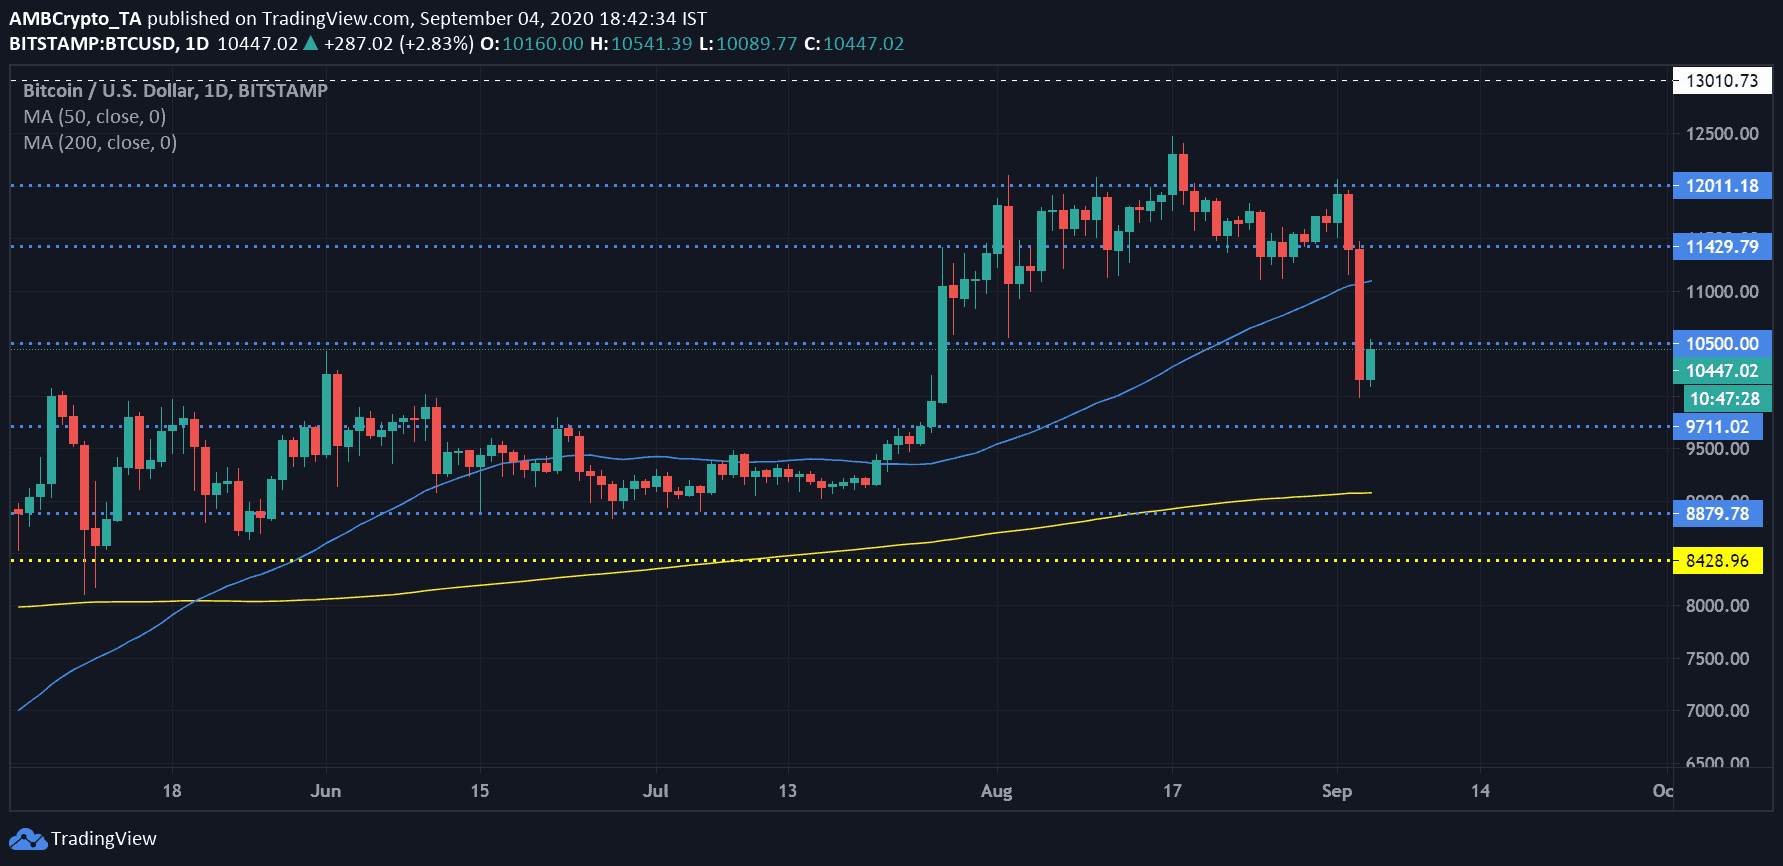
The 1-day chart Bitcoin chart from the trading view highlighted Bitcoin’s movement under the $10,500 resistance as mentioned earlier. The support at $10.5k wasn’t breached over the past month until yesterday. The gap between the current price and immediate resistance at $11,400 becomes immensely wide at the moment, with little chances of recovery right away.
Another major indicator waving red flags in Bitcoin’s face is the 50-Moving Average. It is not acting as underlying support anymore, becoming an overhead resistance at the moment. Right now, it is early to call whether Bitcoin will attain a quick recovery or there will be further decline.
However, the community was inclining towards the latter.
Bitcoin heading down to fill CME gap at $9,600
For some analysts, Bitcoin’s bottom at the moment will arrive at $9.600 due to the apparent CME gap. During the past month’s rally, a CME gap between $9700 and $10,000 was established and the common consensus is that just gaps get filled in the ecosystem whenever they are seen at close proximity to current prices.
In the meantime, Bitcoin’s strong correlation with traditional stocks has also been considered a legitimate reason. During the past 48-hours, Major stocks such as the S&P 500 also dipped in the charts, and Bitcoin commentator Lark Davis suggested,
S&P 500 dumping, and oh big surprise #bitcoin is too!!! As more and more institutions come this is becoming out reality. pic.twitter.com/CiJjDBUaCd
— Lark Davis (@TheCryptoLark) September 4, 2020
However, the correction entertained by Bitcoin may do well for the prices as well, going forward. Due to consistent movement between a fixed range over the past 5 weeks, Bitcoin’s Realized Volatility had hit a yearly-low.
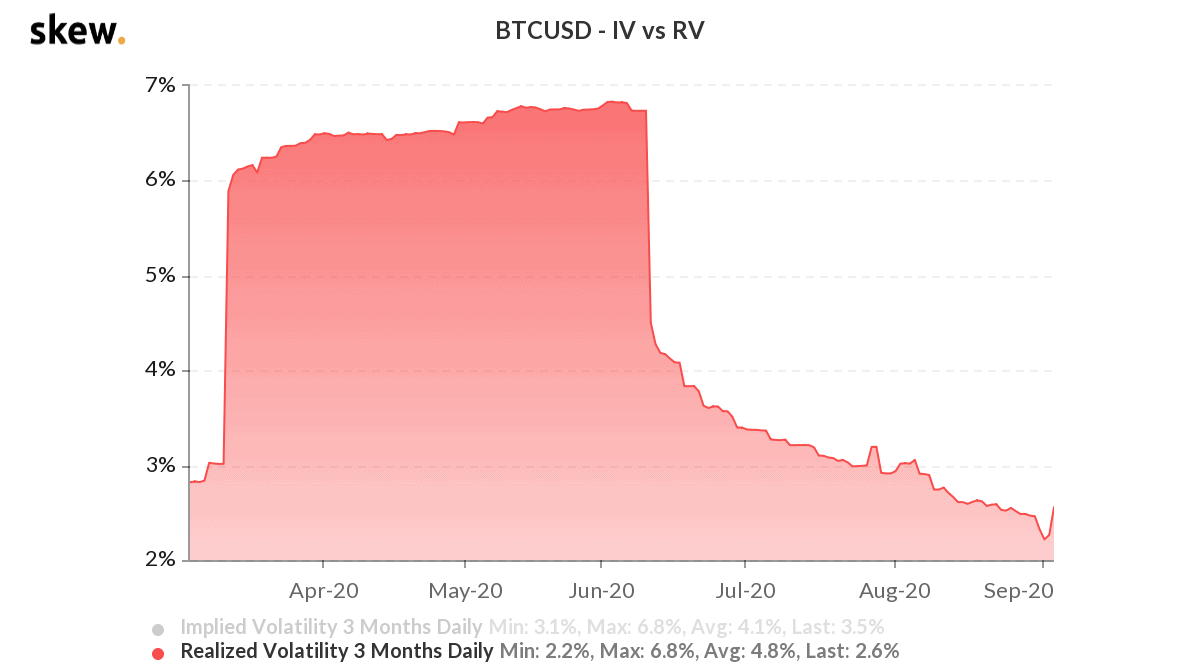
As observed, after dropping down to 2.2%, the RV levels spiked a little over the past 24-hours, indicating a little turbulence. For Bitcoin’s price to stay lively in the charts, RV should remain high but it is important to note that high BTC RV can push the price down as well.
BTC’s imminent destination is unclear
With the absence of general clarity in the market, it is unlikely that Bitcoin will rise immediately at the moment. The buyers exhibited exhaustion and right now, the coin would need to re-instated a trend itself over the next few weeks. The overall trend remains bullish from a yearly-perspective but it mirrors the bearish stretch witnessed during the end of 2019.