
Bitcoin price is once again under selling pressure, with spot ETF outflows and deteriorating technical indicators fueling doubts about a lasting recovery.
Recent moves in institutional funds compound the difficulties for BTC, which is now trading below its 50-day moving average.
Table of Contents
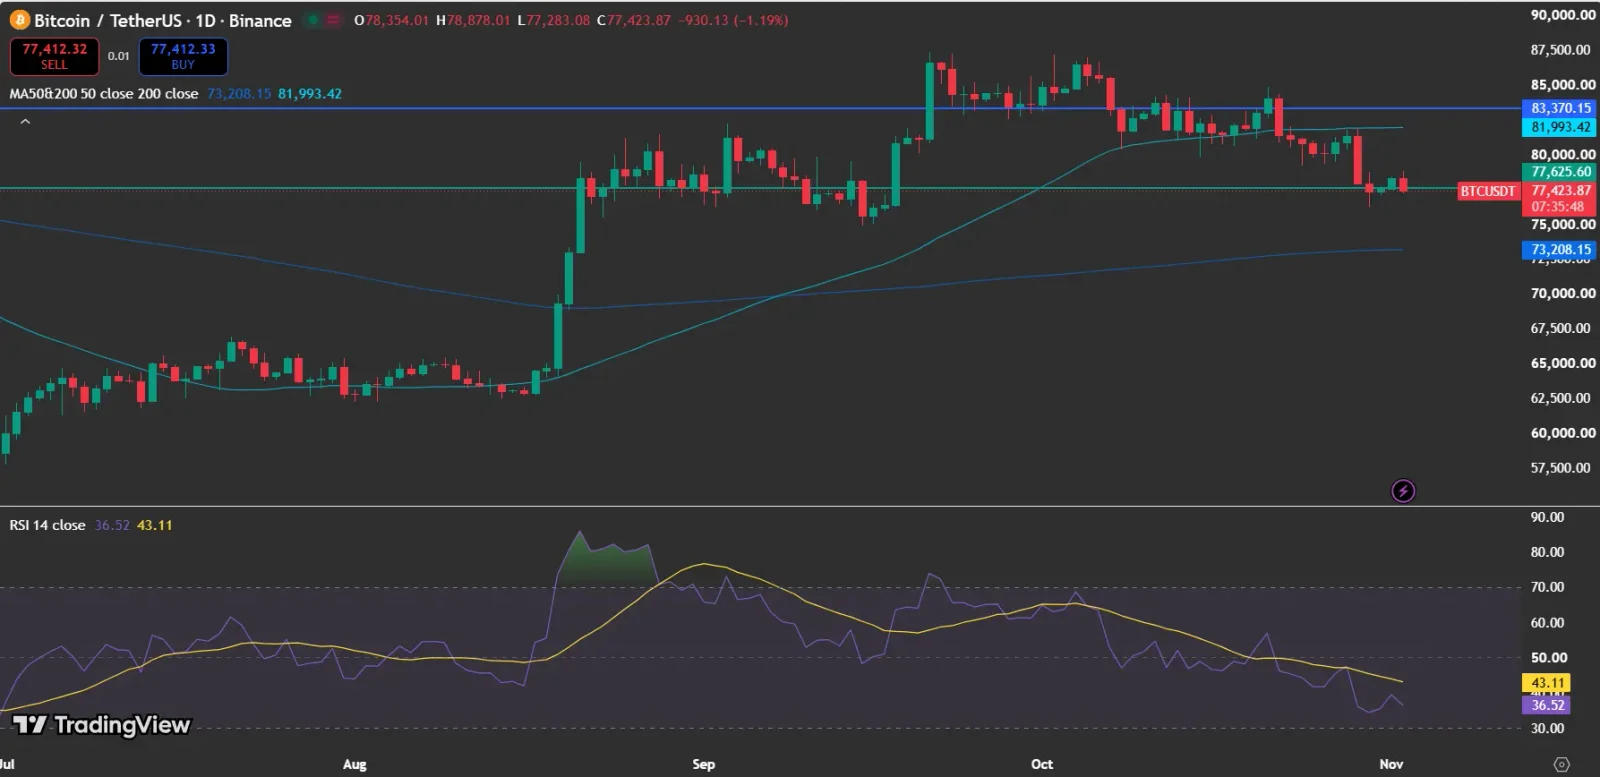
As of press time, the TradingView chart provided shows Bitcoin at $77,423.87, a decline of 1.19%. With ETF flows negative and momentum bearish, attention is centering on the $77,000 level.
Also Read: Bitcoin Price Encounters Key $80K Hurdle as Strive Acquires 6,182 BTC
What Is Causing ETF Outflows From Bitcoin?
Lookonchain reported that on November 2, Bitcoin ETFs saw $614.26 million in daily net outflows, roughly equal to 7,919 BTC. That same update put weekly net outflows at 2,292 BTC, valued at approximately $177.81 million, a sign that institutional fund flows remain under pressure.
These withdrawals carry weight because spot Bitcoin ETFs give investors a regulated way to gain exposure to BTC. Persistent outflows may reduce demand for ETF shares and signal weaker investor appetite for Bitcoin exposure, though daily flows by themselves cannot predict where prices will go next.
Also Read: Bitcoin Price Risks $76K as Ethereum Faces Drop Toward $2,000
What Is the Bitcoin Price Chart Indicating?
On the daily TradingView chart, BTC is trading below its 50-day moving average of $81,993.42 but above its 200-day moving average of $73,208.15. This placement points to near-term weakness, while the 200-day average continues to serve as a possible support level.
The Relative Strength Index (RSI) is at 36.52, beneath its moving average of 43.11. That points to bearish momentum, even though the RSI has yet to fall into the conventional oversold territory below 30.
How Does Bitcoin Open Interest Shape the Outlook?
CoinGlass data indicates Bitcoin open interest stood near $53 billion at the close of October, down from its late-September high of over $60 billion. The drop implies that the dollar value of outstanding derivatives positions has shrunk.
When open interest falls together with prices, it can signal waning participation or the unwinding of leveraged positions. Still, absent liquidation and funding-rate data, it is hard to tell whether long-position liquidations are behind the latest price action.
Also Read: Bitcoin Price Forecast: Could BTC Surge 30% Following the FOMC?
Is a Bitcoin Price Recovery Above Resistance Possible?
Bitcoin is under immediate pressure near $77,000, and the latest TradingView candle posted a low of $77,283.08. If the price breaks decisively below this zone, the $75,000 area could come into focus as the next psychological level to watch.
To the upside, BTC must first reclaim the 50-day moving average at $81,993.42, with resistance then sitting near $83,370.15. As long as price remains below these levels, the chart continues to favour a cautious outlook.
Which Bitcoin Price Levels Should Traders Monitor Next?
Bitcoin’s technical softness and ETF outflows support a bearish short-term view, yet neither one ensures that prices will keep falling. An upturn in ETF flows together with a push above key resistance could improve market sentiment.
Crypto markets stay highly volatile, so traders should keep an eye on price action, market sentiment, and upcoming catalysts before committing to any investment decisions.
Also Read: Bitcoin Price Under New Pressure as Whales Move $200M
This article contains market analysis and price predictions. These are not guarantees. Crypto markets are volatile. Always DYOR. Not financial advice.