• Skip to primary navigation
  • Skip to main content
  • Skip to primary sidebar
  • Skip to footer
  • About us
  • Write for us
  • Terms and Conditions
  • Privacy Policy
  • Disclaimer
  • Contact
  • All Posts
  • Advertise

TronWeekly

Crypto World News

  • Home
  • Education
    • Best TRON Wallets
    • Beginner’s guide to TRON
  • Opinion
    • Tron Tokens
    • Market Analysis
  • Industry
    • Tron Exchange
    • Project Review
  • Press Release
  • Advertise
  • About us
    • The Team
    • Editorial Policy
    • Write for us
    • Privacy Policy
    • Disclaimer
    • Terms and Conditions
    • Contact
You are here: Home / News / Chainlink [LINK] Could Retrace Below $20 If Bears Continue Grazing In Its Market
Chainlink

Chainlink [LINK] Could Retrace Below $20 If Bears Continue Grazing In Its Market

January 27, 2021 by Sahana Kiran

All the new cryptocurrencies emerged this year. Chainlink [LINK] and Polkadot [DOT] climbed up the crypto ladder in terms of market cap as well as price. While BTC slumped down to $31,734, ETH and other coins followed suit. XRP, made way for DOT as its market cap preceded to $15 million. XRP during the time of writing was down to $0.26. ETH and DOT were dipping down by 10% in the last 24-hours. The overall market cap of the crypto-verse was also on a downhill journey as it was seen at $931.44 billion from a high of $1.6 trillion.

Chainlink [LINK], at the time of writing, was depleting down to $22.28 with a 24-hour price change of a negative 9.11%. The market cap of the seventh-largest coin was at $8.99 billion, ahead of prominent cryptocurrencies like Litecoin, Bitcoin Cash as well as Binance Coin.

Chainlink [LINK] One-Hour Price Chart

download 10 1

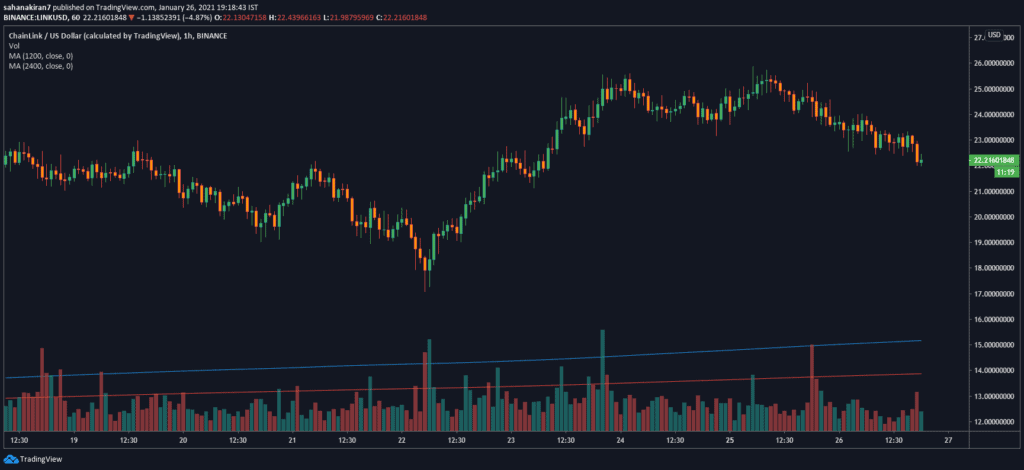
The one-hour price chart of Chainlink on Binance affirmed that the bulls were still in its market. While the volume in the LINK market was mediocre, the daily moving average indicator formed a bullish crossover. The 50 daily moving average [blue] was above the 100 daily moving average [red].

This was quite surprising as the other indicators were revealing contradicting sentiments.

Chainlink [LINK] Price Chart With Indicators

download 11 1

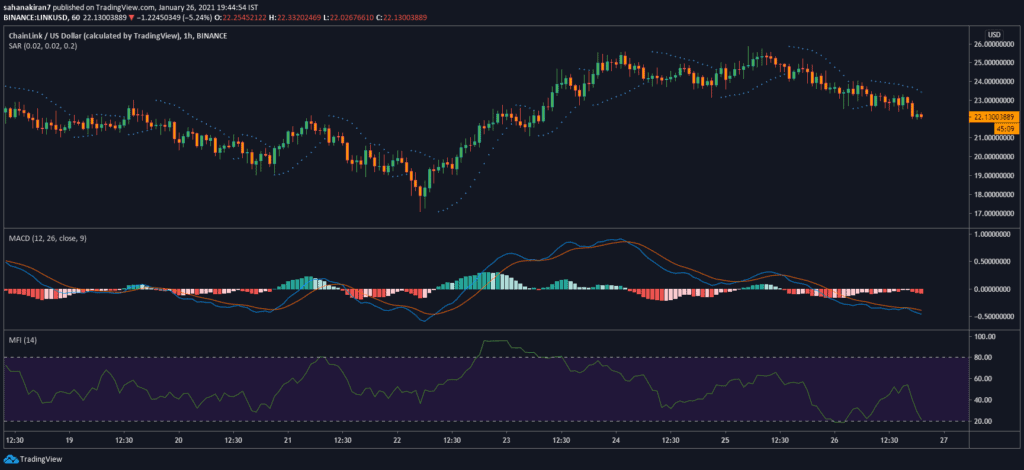
The bears had infiltrated the LINK market. The Parabolic SAR indicator had been exhibiting a bearish sentiment for quite a while now, with an array of fluctuations. The indicator had set up dotted lines above the candlesticks with hindering the chances of an upward breakout. The MACD indicator had undergone a bearish crossover. Earlier today, the signal line took over the MACD line demonstrating a bearish sentiment.

The Money Flow Index indicator revealed that the LINK market was in the oversold zone. If the bears continue to reign the LINK market, the asset could drop down below $20.

Filed Under: News, Altcoin News, Market Analysis Tagged With: Chainlink (LINK)

Primary Sidebar

Recent Posts

  • Polkadot’s [DOT] Pullback Near $30 Appears Imminent March 8, 2021
  • Ethereum [ETH] Whales Now Owns ~70% Of Total Supply March 7, 2021
  • Did Justin Sun Just Bid $2M On Jack Dorsey’s First Tweet NFT? March 7, 2021
  • Ethereum Devs Induce EIP-1559 Into London Hard Fork; Will The Miners Revolt? March 7, 2021
  • Ethereum [ETH] Seeks Help From The Bulls To Get Back On Its Feet March 6, 2021


Footer

News

  • Altcoin News
  • Bitcoin News
  • Blockchain
  • Tron News
  • World

Digest

  • Meet the Founder
  • Price Winning Article
  • DeFi
  • Cyber Security
  • Crypto Scam

Industry

  • Project Review
  • Technology
  • Fintech
  • Tron Exchange
  • New in Town

Tron Universe

  • Event and Tron Parties
  • New in Town
  • Tron Tokens

Follow Us

Subscribe US

Copyright © 2021 · Tron Weekly. All Rights Reserved. NOTE: Tron Weekly is an independent crypto news site that adheres to the strict journalism policy anchored on transparency, trust, and objectivity, we have no affiliation with the TRON Foundation, its founder Justin Sun or any other cryptocurrency firm.