![Chainlink [LINK] Surges Close To $30; Eyes At A Relief Rally](https://www.tronweekly.com/wp-content/uploads/2021/03/action-1867052_1280-e1614694616761.jpg)
Chainlink [LINK] gained a much-needed upside momentum after weeks of dull price action. This helped it negate the losses and instead flip weekly gains of more than 16%.
Despite a major retreat from its all-time high above $35, the crypto-asset made a turnover to a crucial resistance level.
Chainlink [LINK] was up by 11.95% over the last 24-hours which drove the token value to $29.60. The extended sell-off period pushed the crypto-asset to the ninth-position on the crypto leaderboard.
Chainlink [LINK] Daily Chart:
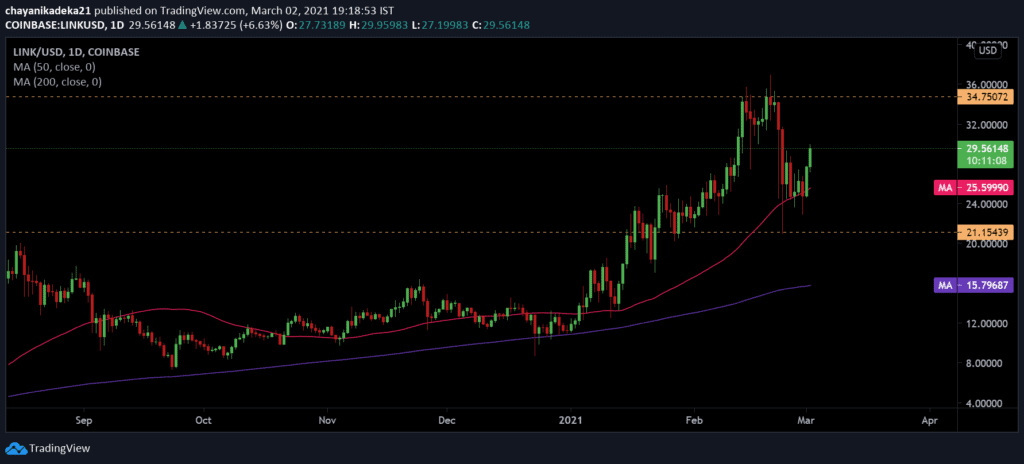
Chainlink [LINK] underwent a bearish breakout after a month-long upward streak. The placement of the moving average remained unfazed by the plunge. The crossover between the LINK candles with the 50 DMA [Pink] was short-lived as the moving average settled below the former after the recent price rise.
Also, the 200 DMA [Purple] continued to hover quote below the 50 DMA as well as the candlesticks which was also suggested a bullish phase for the coin.
The gauge between the two moving averages continued to be on the rise which was a positive sign for LINK’s price action. The above chart depicted a strong buying at lower levels.
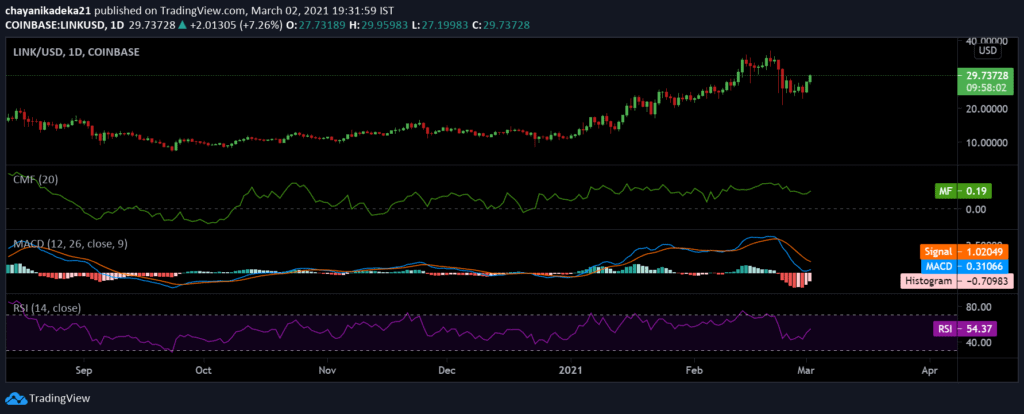
The Chaikin Money Flow noted a minor uptick indicating a inflow of capital in the coin market as price began to recover from slumber.
In addition, MACD hinted at a bullish reversal after being position on the negative side for nearly two weeks.
The RSO also recovered from the bearish territory as it made headway above the 50-median line depicting a rising sentiment buying pressure in the Chainlink market among the investors.
If the bulls manage to stall a correction at the current level LINK could target its immediate resistance level of $34. If the predicted bullish momentum fails to transpire, Chainlinnk could dip all the way down to its nearest support of $25.5. Failing to hold this level, could trigger another drop to the $21.5 support area.