• Skip to primary navigation
  • Skip to main content
  • Skip to primary sidebar
  • Skip to footer

TronWeekly

Crypto World News

  • Home
  • Education
    • Best TRON Wallets
    • Beginner’s guide to TRON
  • Opinion
    • Tron Tokens
    • Market Analysis
  • Industry
    • Tron Exchange
    • Project Review
  • Press Release
  • Advertise
  • About us
    • The Team
    • Editorial Policy
    • Write for us
    • Privacy Policy
    • Disclaimer
    • Terms and Conditions
    • Contact
You are here: Home / News / DOT hovering over monthly lows but, accumulation is on the rise; Bulls to take over?
DOT

DOT hovering over monthly lows but, accumulation is on the rise; Bulls to take over?

December 2, 2021 by Parth Dubey

DOT prices are bearish for a second consecutive day as the prices fall by nearly 2.6%. The trading volume has also fallen as well as the market cap. The prices have been at the lowest levels in the past 30 days.

In the past 30 days, the token rose to an ATH above $55 and fell to a low price of $32.75. Currently, the token is at $35.7 and aims for higher prices, but the volumes are not enough.

Data from CoinMarketCap shows that the trading volume of the token dropped by over 24.93% and is currently at $1.16 billion, while the market cap of the token dropped by 4.76%. The market rank of Polkadot is 9th, with a market cap of $35.1 billion.

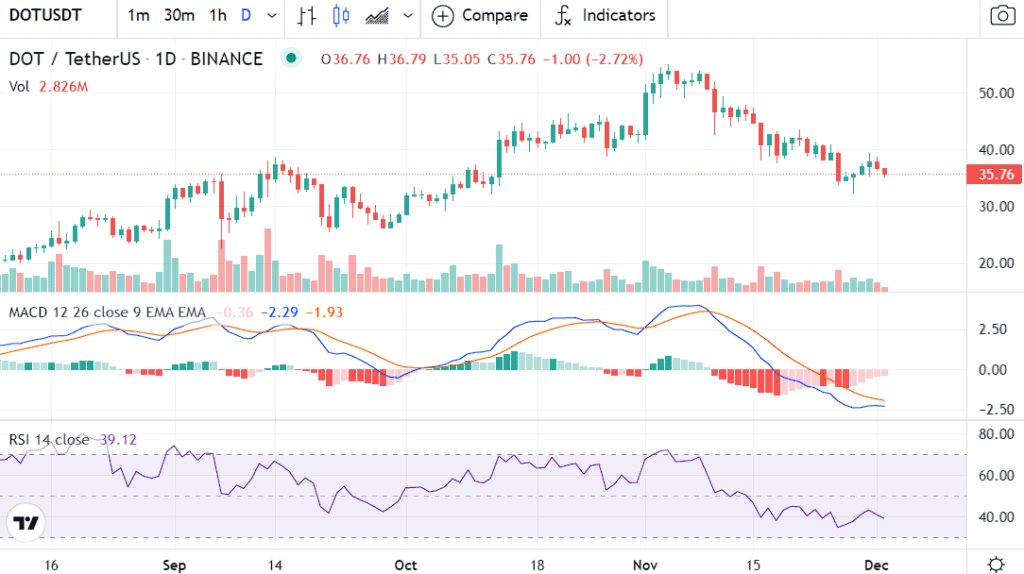
The prices opened today’s daily candle at $36.76 and reached a daily low of $35.05. The daily high stands at $36.79, while the overall trend is bearish following the crash in mid-November.

DOT price analysis on the daily chart

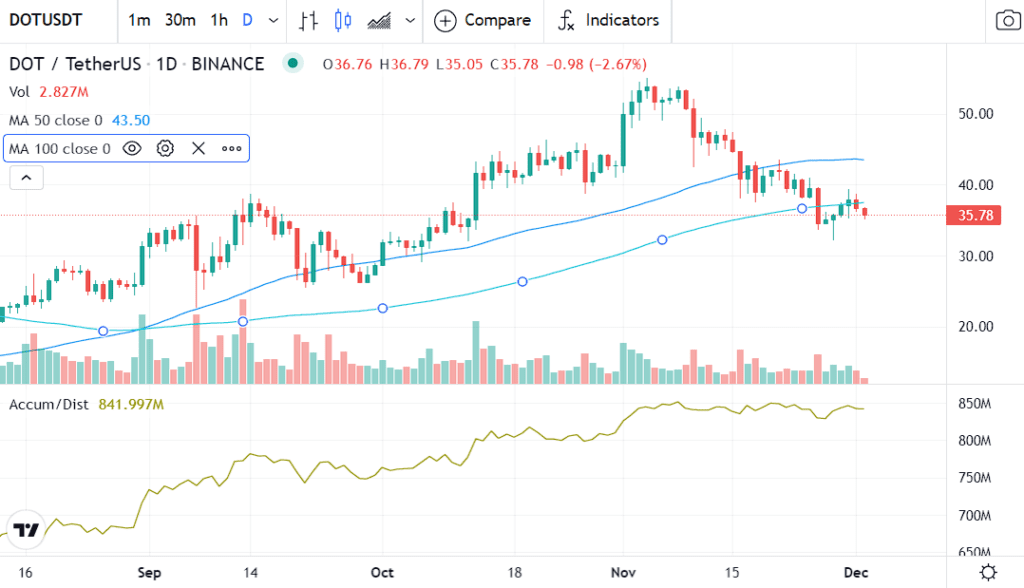
The daily chart shows that the DOT token is currently under bearish pressure as the prices fell below the 50-day Moving Average as well as the 100-day Moving Average. If such conditions continue to prevail, we can expect lower prices for the token.

The Polkadot price chart below shows that the accumulation of the token continues to increase. The trend is bearish while the A/D line is still rising. A bullish breakout is possible for Polkadot soon.

DOT price analysis
Polkadot price analysis on the daily chart by TradingView

The MACD line is progressing below the signal line, which is a bearish sign indicating lower prices. However, the two lines are closing in, and the possibilities of bullish divergence are increasing.

The RSI levels have entered the bearish region, and the gradient is negative. This means that lower prices are possible as prices are entering the overbought region.

image 1
price analysis on the daily chart by TradingView

Filed Under: News, Altcoin News Tagged With: DOT, polkadot

Primary Sidebar

Recent Posts

  • Strategy Doubles Down: Saylor Signals Massive 10th Bitcoin Buy Streak June 16, 2025
  • TIA Eyes Breakout: Falling Wedge Signals Bullish Reversal Toward $4.20  June 16, 2025
  • Filecoin (FIL) Charts Signal Bullish Reversal – Analysts Eye $5 Target in 2025 June 16, 2025
  • Ethereum’s Next Move? Technical Chart Hints at Major 2025 Rally June 16, 2025
  • Chainlink (LINK) Forms Head and Shoulders Pattern, Further Drops Could Hit $10-11 June 16, 2025

Footer

News

  • Altcoin News
  • Bitcoin News
  • Blockchain
  • Tron News
  • World

Digest

  • Meet the Founder
  • Price Winning Article
  • DeFi
  • Cyber Security
  • Crypto Scam

Industry

  • Project Review
  • Technology
  • Fintech
  • Tron Exchange
  • New in Town

Tron Universe

  • Event and Tron Parties
  • New in Town
  • Tron Tokens

Follow Us

Subscribe US

Copyright © 2025 · Tron Weekly. All Rights Reserved. NOTE: Tron Weekly is an independent crypto news site that adheres to the strict journalism policy anchored on transparency, trust, and objectivity, we have no affiliation with the TRON Foundation, its founder Justin Sun or any other cryptocurrency firm.