• Skip to primary navigation
  • Skip to main content
  • Skip to primary sidebar
  • Skip to footer
  • About us
  • Write for us
  • Terms and Conditions
  • Privacy Policy
  • Disclaimer
  • Contact
  • All Posts
  • Advertise

TronWeekly

Crypto World News

  • Home
  • Education
    • Best TRON Wallets
    • Beginner’s guide to TRON
  • Opinion
    • Tron Tokens
    • Market Analysis
  • Industry
    • Tron Exchange
    • Project Review
  • Press Release
  • Advertise
  • About us
    • The Team
    • Editorial Policy
    • Write for us
    • Privacy Policy
    • Disclaimer
    • Terms and Conditions
    • Contact
You are here: Home / Archives for altcoin technical analysis

altcoin technical analysis

Polkadot, Chainlink, Binance Coin Technical Analysis on 13th September 2020

September 13, 2020 by Reena Shaw

The collective cryptocurrency market cap rose to $348 billion as Bitcoin‘s dominance declined by 55.8%. As Bitcoin continued to consolidate between a tighter range, several altcoins appeared to be pushing above key resistance levels.

Polkadot [DOT]

DOT e1599977548336

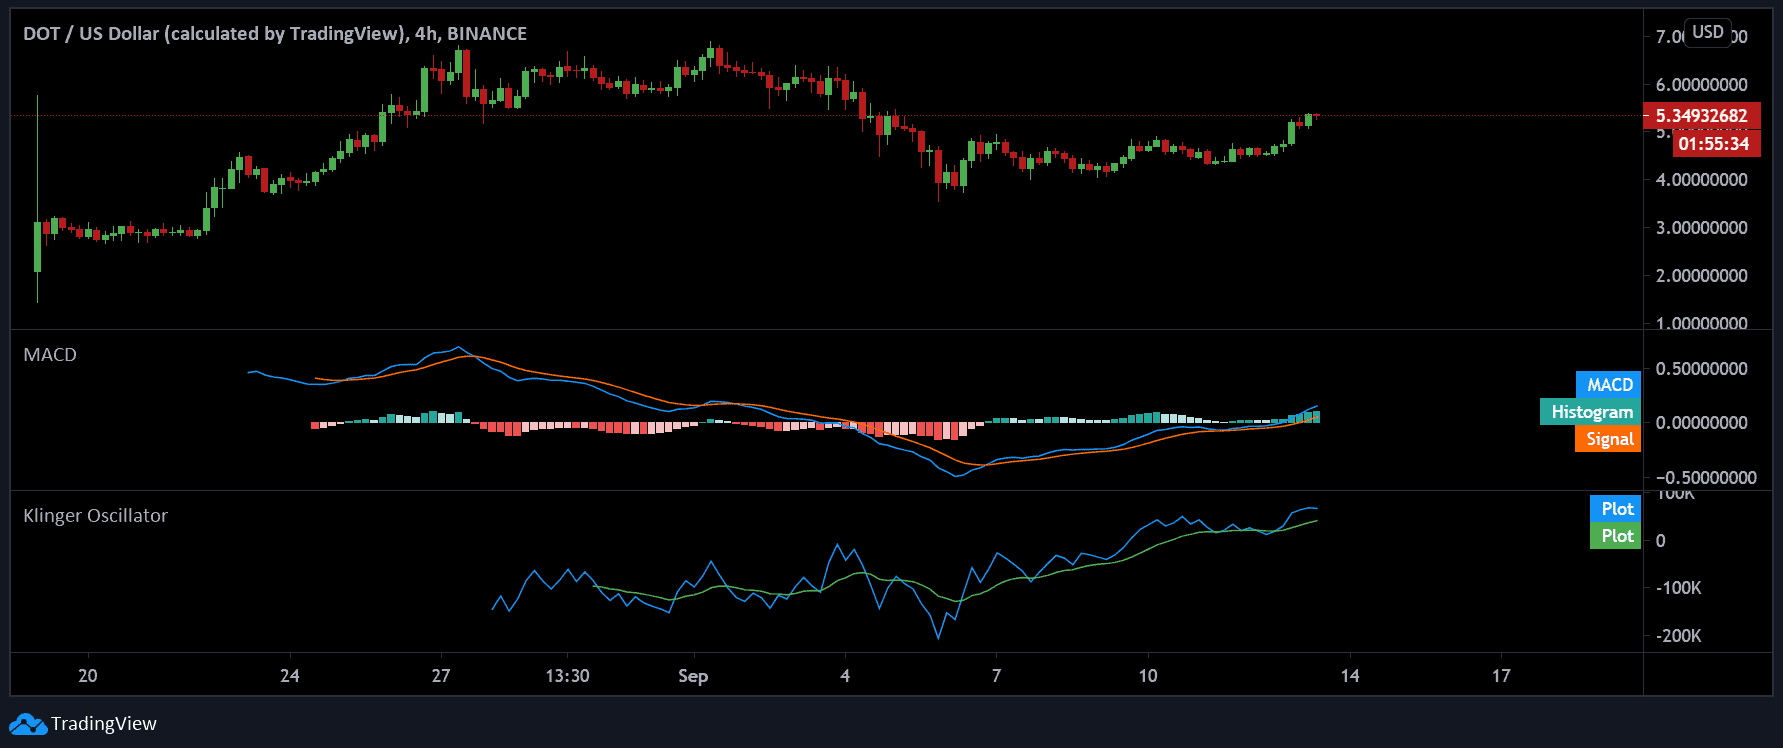
A couple of weeks ago, the blockchain interoperability project Polkadot was not even in the top 100. But today, it stands tall as the fifth largest coin with a market capitalization of $991.53 million and a 24-hour trading volume of $852 million. After yet another surge of 17.29% over the past day, the coin was priced at $5.31, at the time of writing.

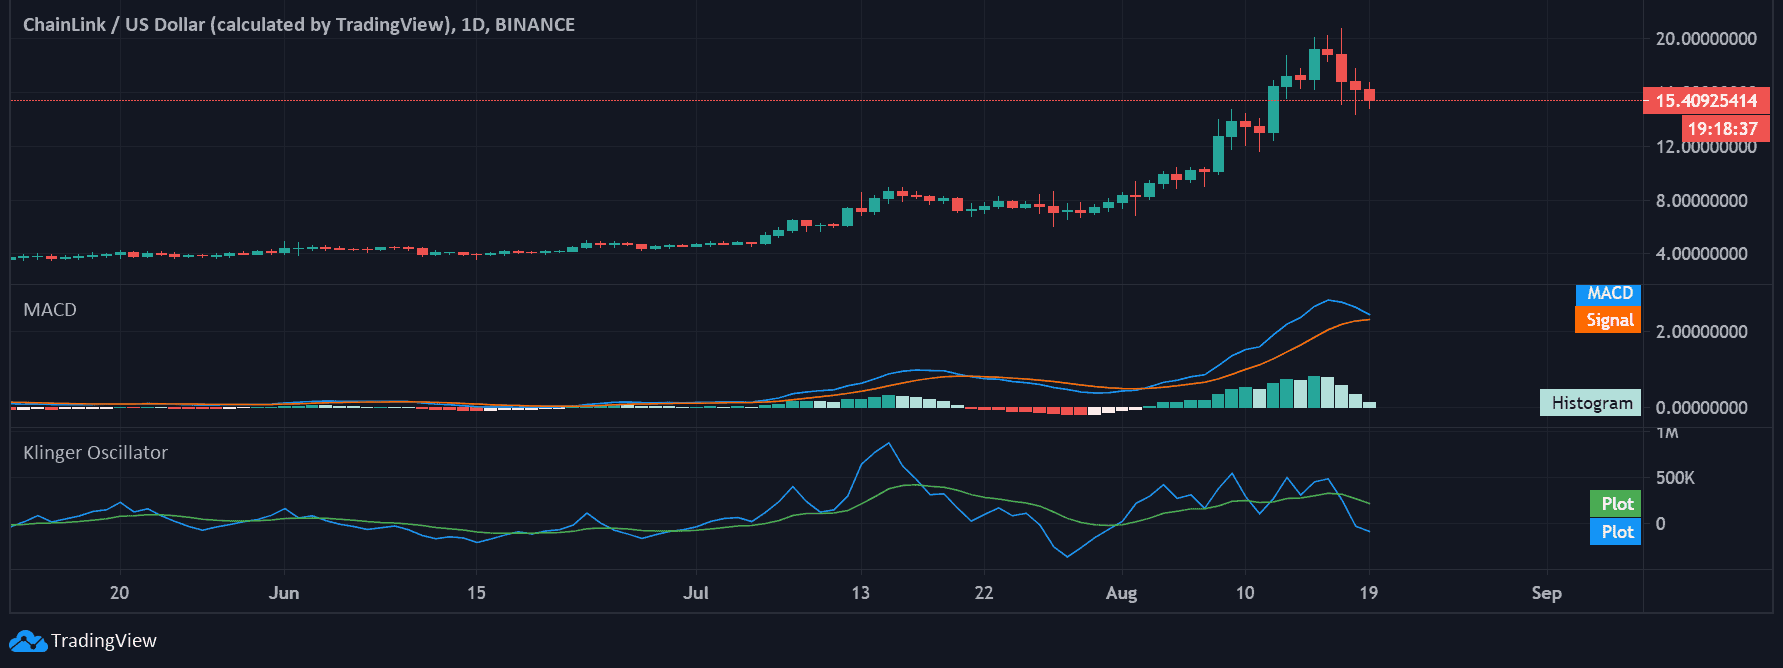
On the technical side, DOT hit crucial support of $4.01. However, the coin’s tryst with the bears was brief as it renounced following gaining necessary bullish momentum. As evidenced by both MACD and Klinger Oscillator on the 4-hour price chart for DOT, the token was exciting a positive trend that could propel it to reach an overhead resistance of $5.82.

Chainlink [LINK]

LINK 3 e1599977717808

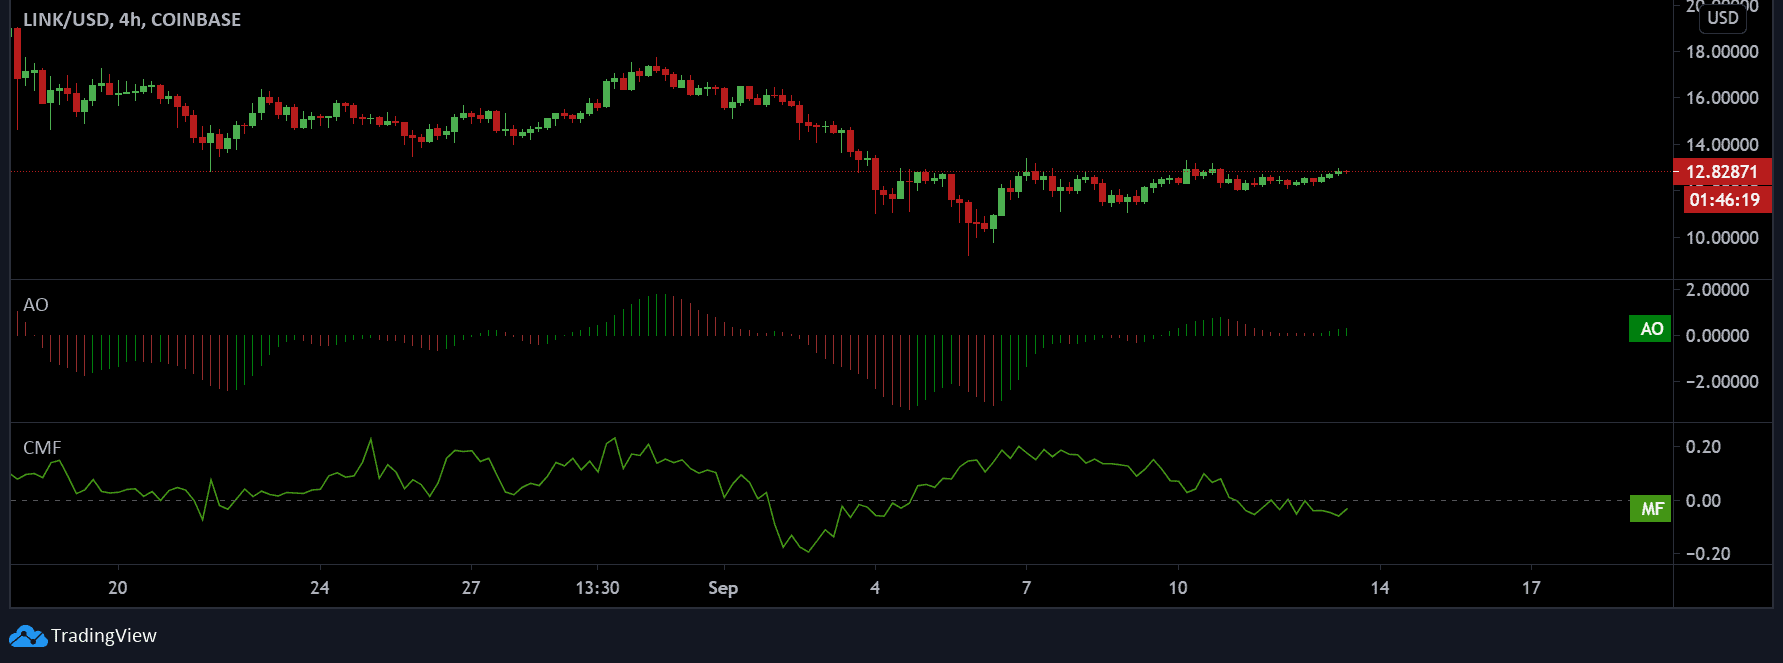
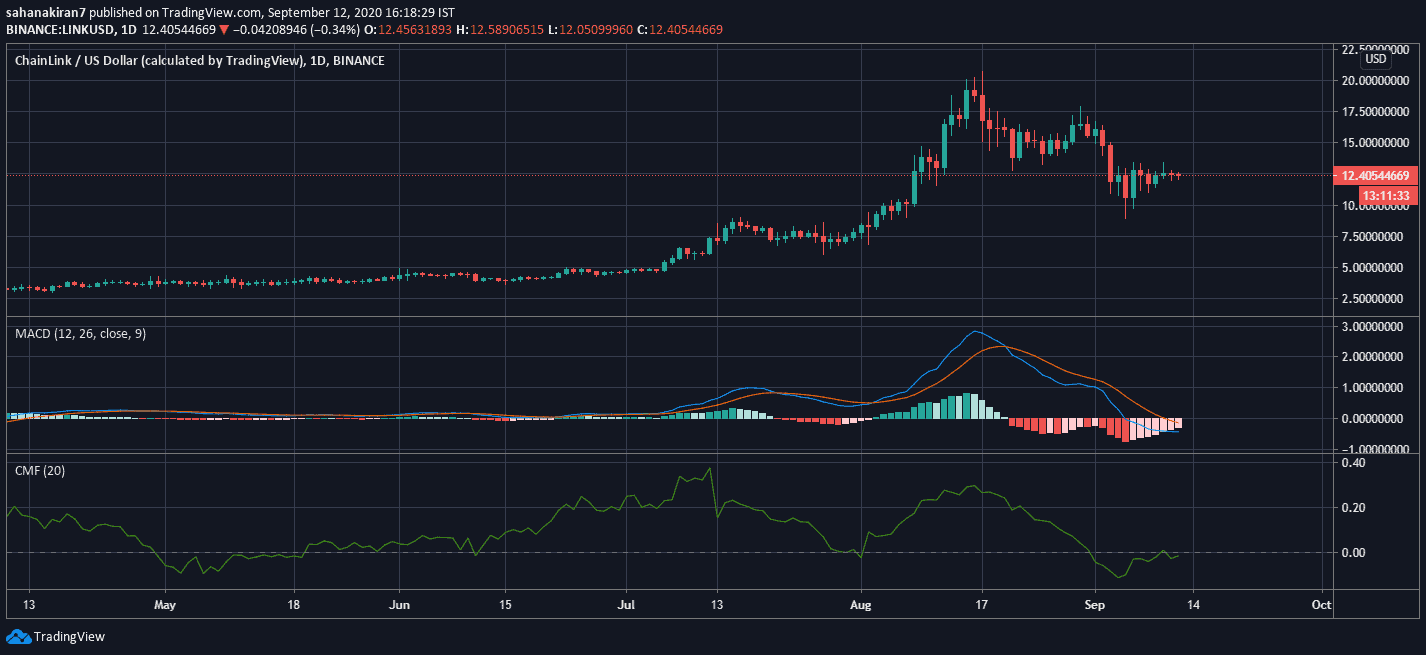
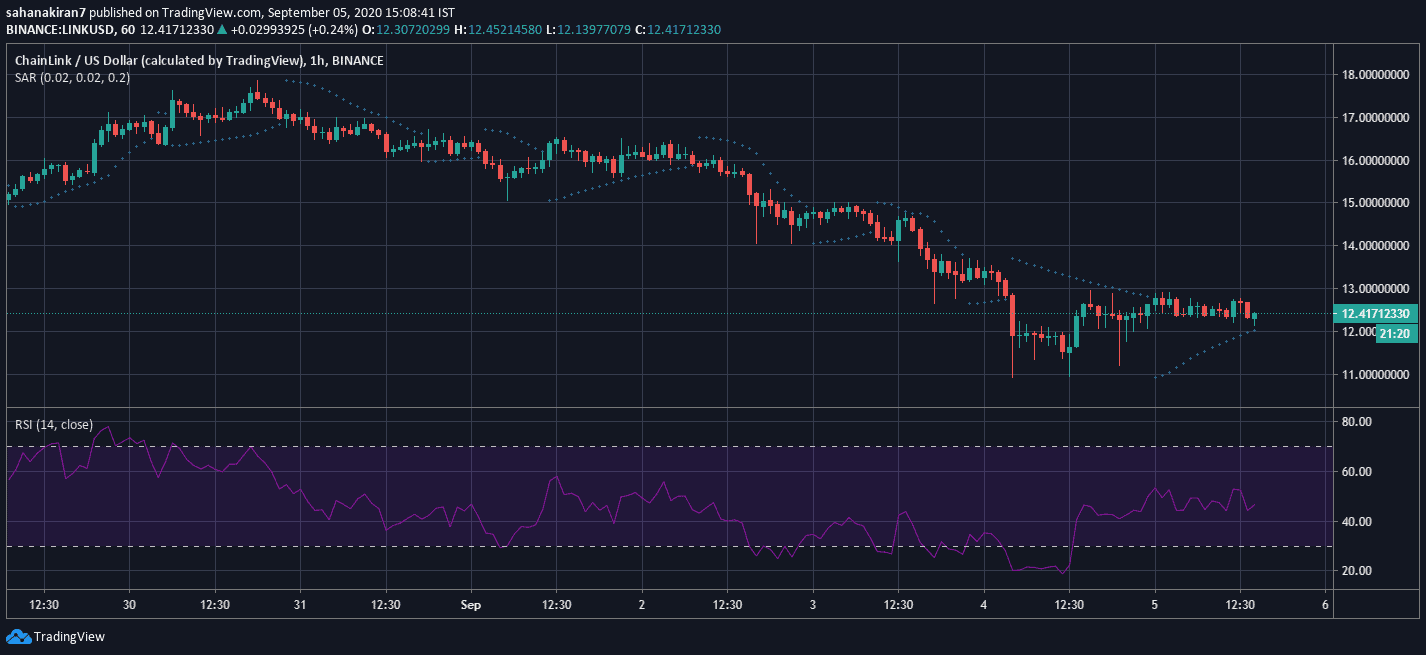
LINK was up by 4.56% which pushed the price to $12.90 as it held a market cap of and a 24-hour trading volume of $4,51 billion and a 24-hour trading volume of $5.80 billion, at the time of writing.

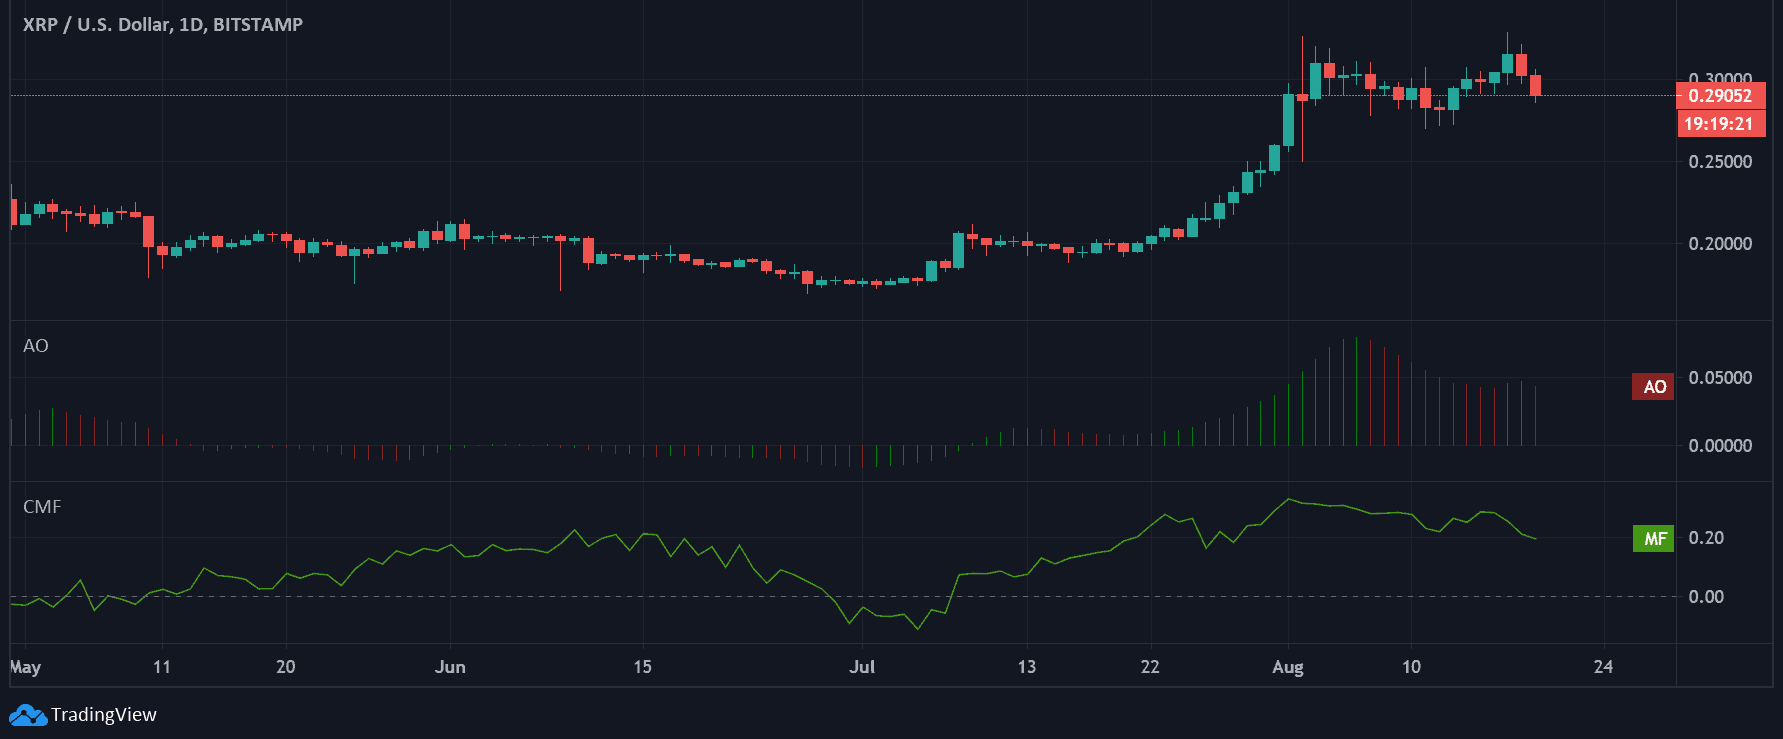
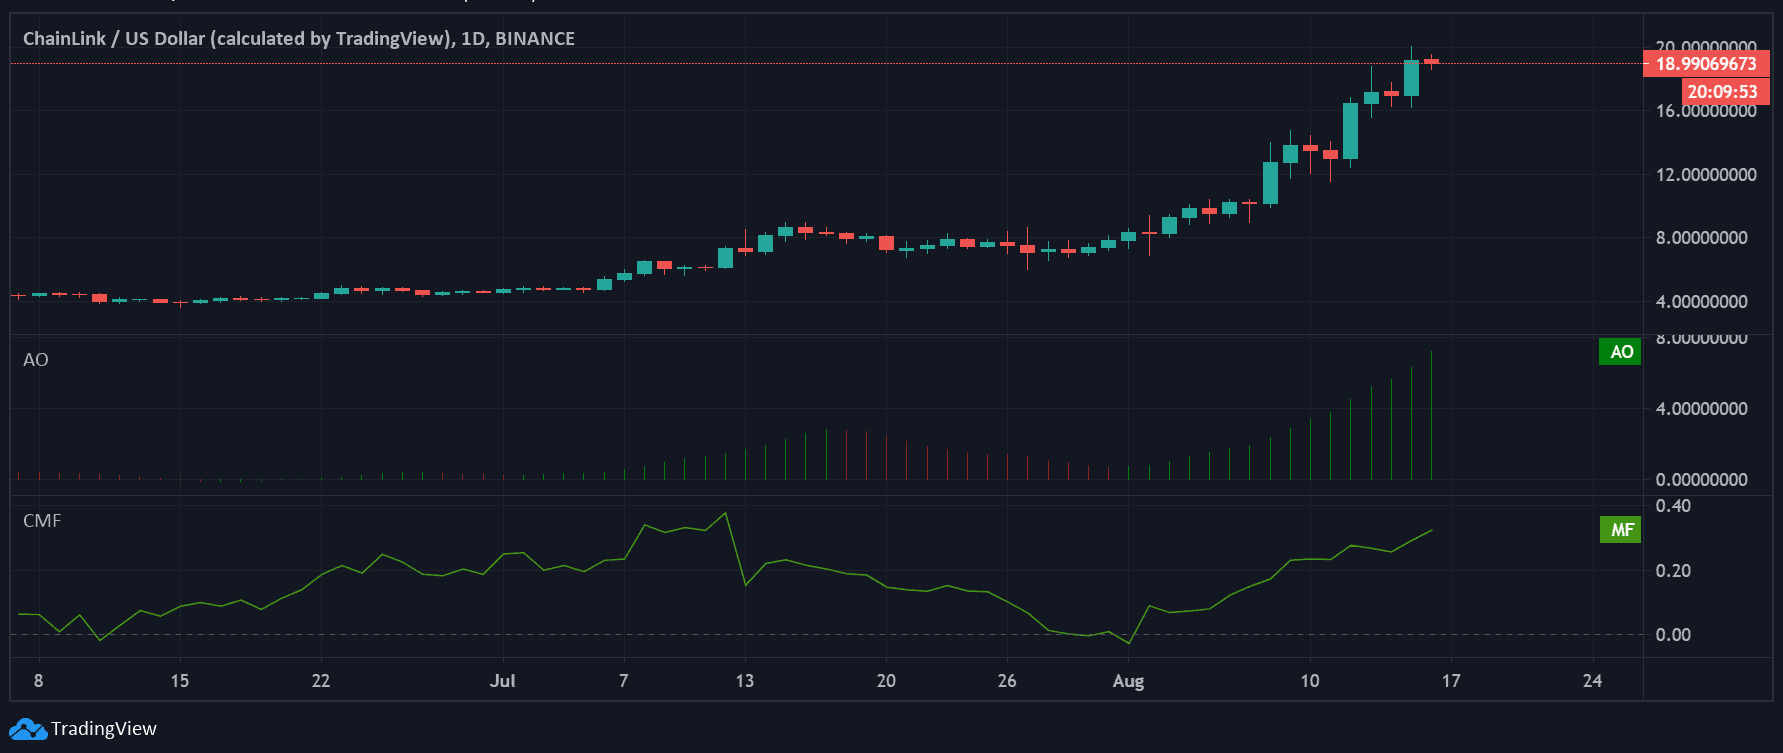
In the short-term chart for LINK, bulls appeared to be making a comeback following the latest uptick.  Awesome Oscillator witnessed a resuming bullish momentum with the green closing bars. However, Chaikin Money Flow was still below the zero-line depicting the bearish presence. If the token manages to retain the necessary momentum, it could target its immediate resistance at $13.5. But if the bulls continue to have an upper hand, LINK could slide to the support level of $10.33.

Binance Coin [BNB]pP

BNB 1 e1599982748959

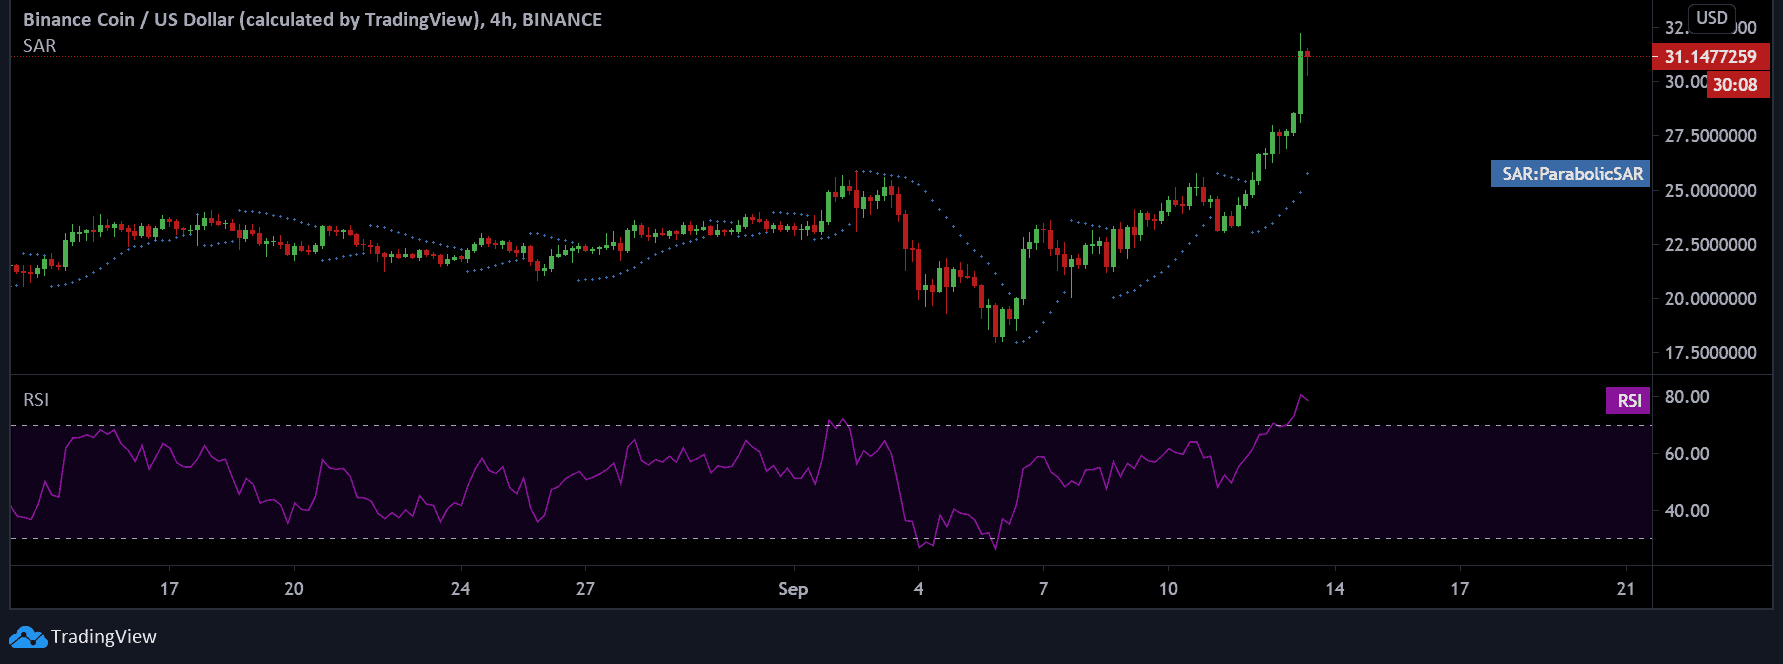
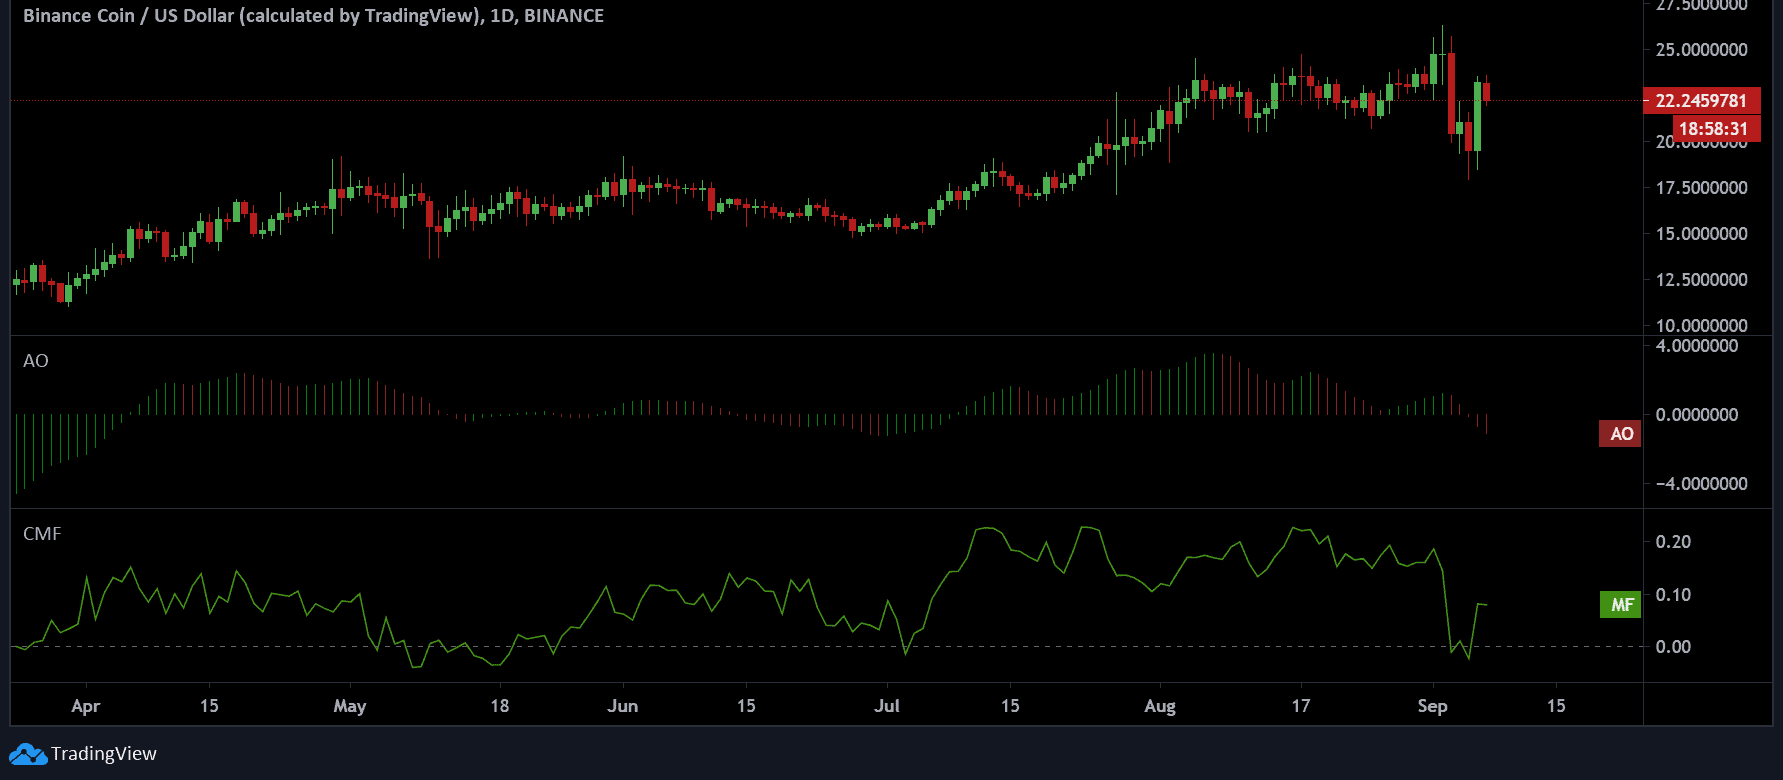
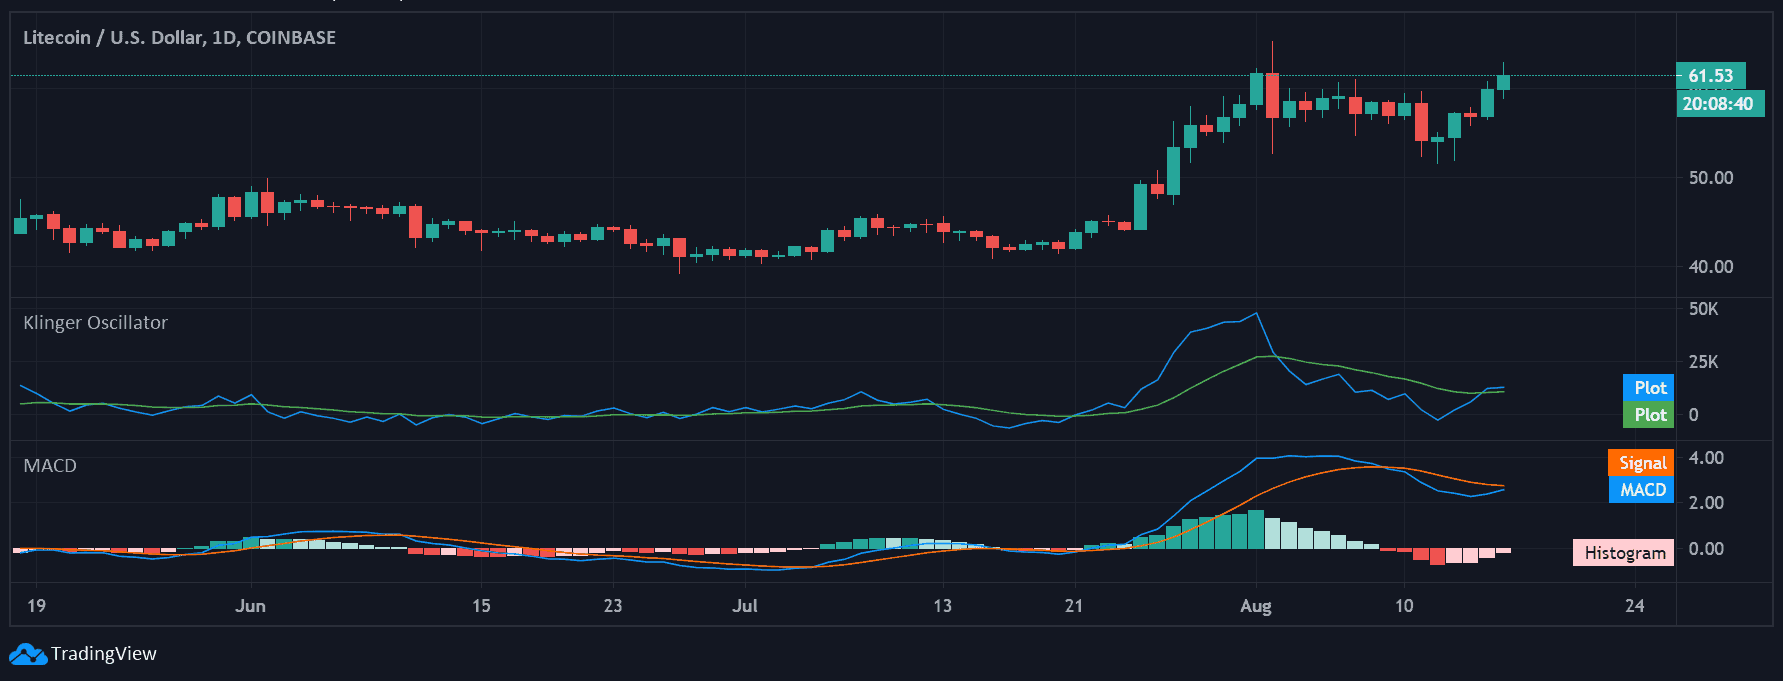
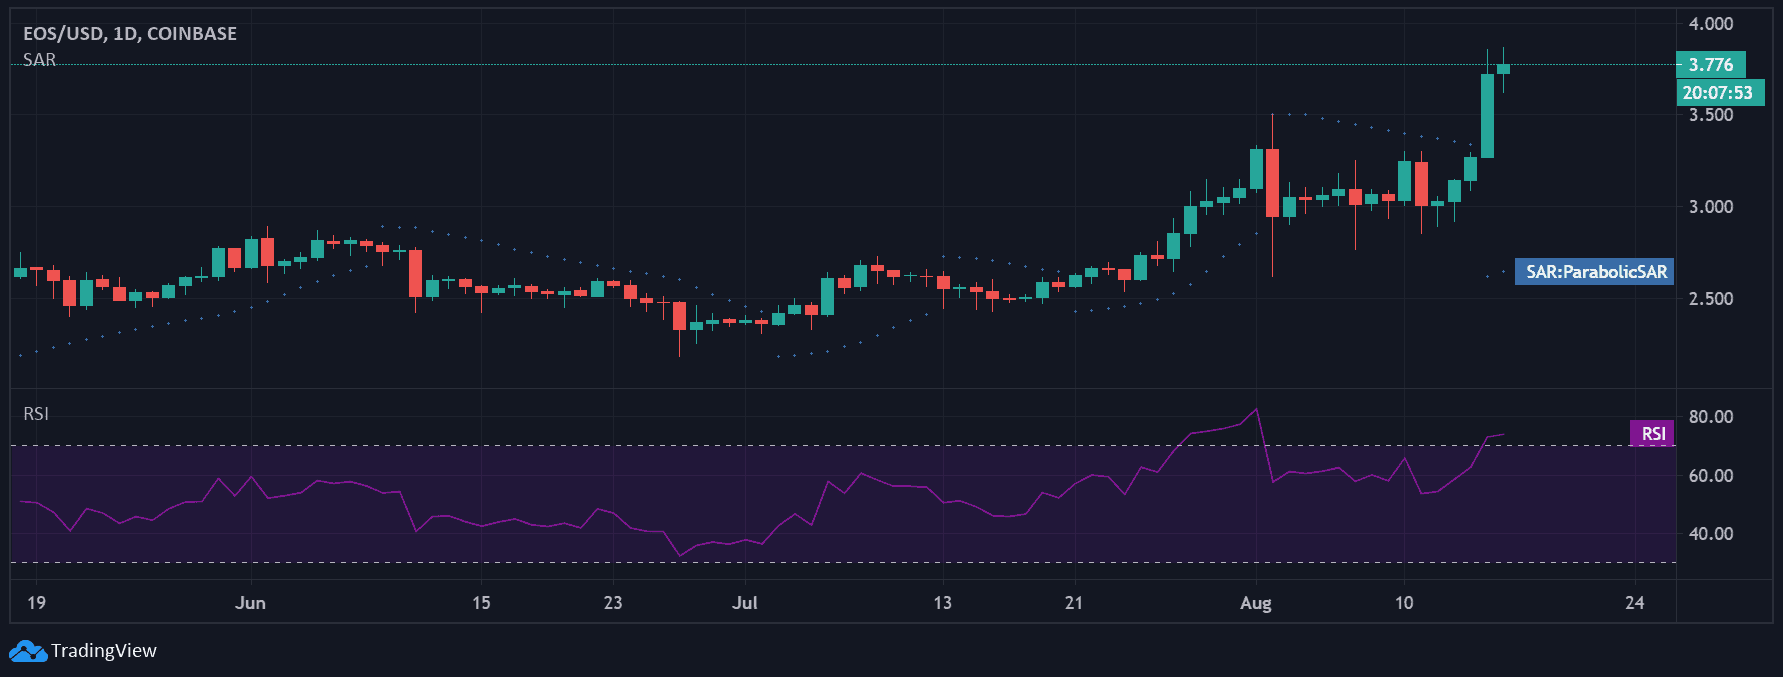
BNB has made a consistent upward trend but turned down from the resistance of $31.38. At the time of writing, the coin registered a market cap of $4.49 billion and a 24-hour trading volume of $1.169 billion.

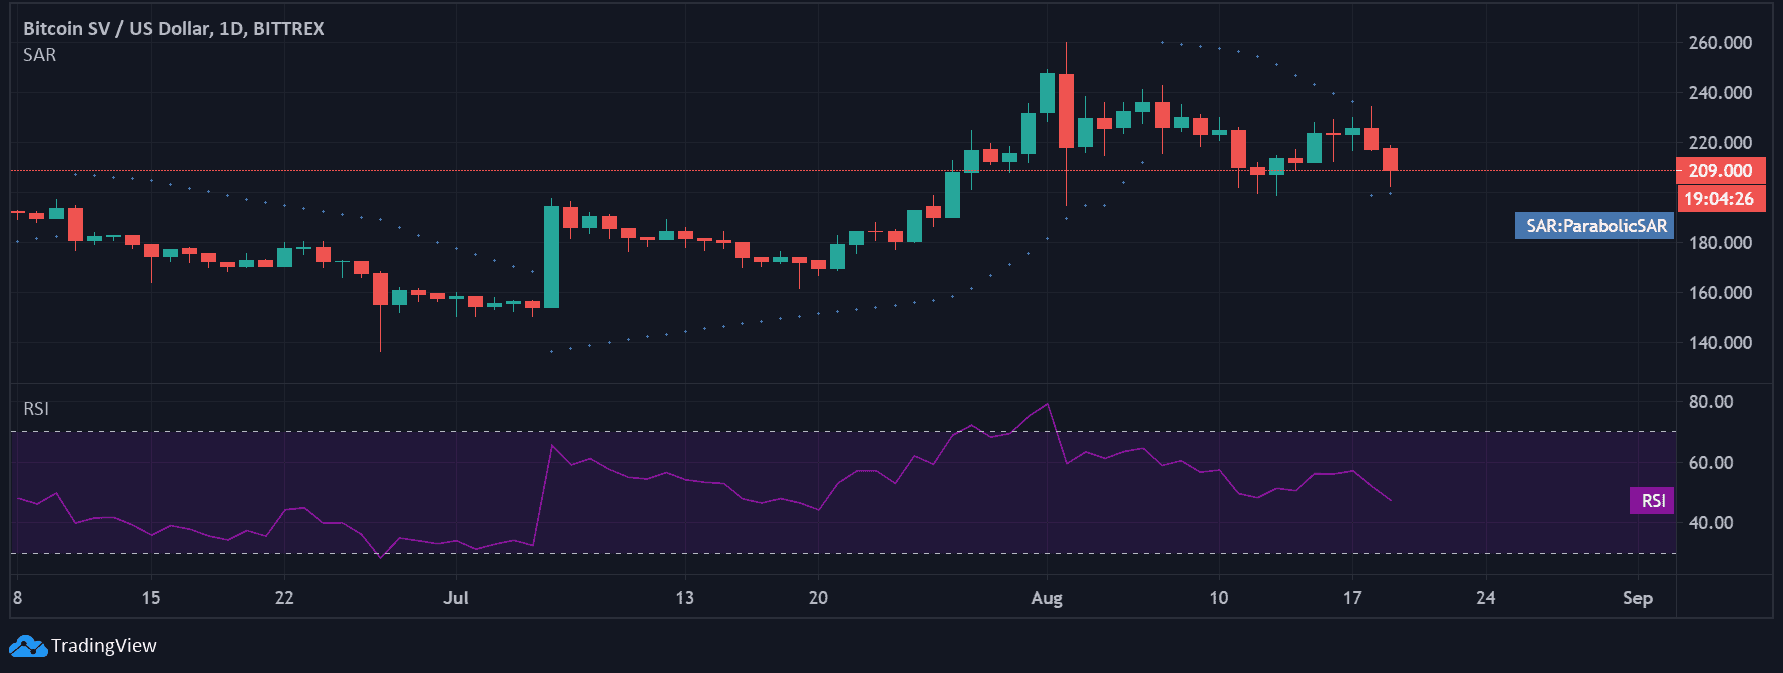
The dotted markers of Parabolic SAR aligned below the BNB price candles resisting a downward price action. The RSI was also well above the 50-median neutral line depicting a sentiment of high buying pressure among the traders in the coin market. If this trend persists, the coin could climb to immediate resistance of $34.98, a level unseen since July 2019. The coin’s support level was found to be at $23.11.

Filed Under: Altcoin News, News Tagged With: altcoin technical analysis, altcoin tradingview, Binance Coin (BNB), binance coin technical analysis, binance coin tradingview, Chainlink (LINK), chainlink technical analysis, chainlink tradingview, polkadot

Chainlink, Ethereum, XRP Technical Analysis on 12th September 2020

September 12, 2020 by Sahana Kiran

During the time of writing, the entire crypto market was painted green as several coins witnessed dainty gains while a few others were surging towards new highs. The overall market capitalization stood at $340.44 billion, however, Bitcoin’s dominance was still stuck at 56.2%

Chainlink [LINK]

LINK turned several heads in the crypto-verse this year with its drastic price growth. Back in August, the coin went on to hit an all-time high of $19.85, however, LINK didn’t seem to follow an upward trajectory. At the beginning of this month, the coin dipped to a low of $10.23. With a market cap of $4.35 billion, the coin was trading for $12.42, at press time.

download 11

The MACD indicator highlighted the presence of bears as it prolonged its bearish crossover that took place during August. However, the MACD and the signal line were seen slightly coming together for a potential crossover. Chaikin Money Flow was clearly drowned in the bearish territory as the outflow of capital was noted in the LINK market. If bears lengthen their stay in the LINK market, a critical support line at $9.72 could be destroyed.

Ethereum [ETH]

ETH had a good run at the beginning of September, the altcoin was on its way to hit $500 as it rose up to a high of $476.50. However, the coin came plummeting down to $371.19 during the time of writing. The second-largest coin with a market cap of $41.76 billion was seen increasing by 1.03%

download 12

The Parabolic SAR indicator formed dotted lines above the candlesticks preventing any potential uptrend. The dotted marker indicated a bearish sentiment and had previously pushed ETH below a strong support level of $364.30. Yet, Klinger Oscillator indicated the presence of bulls in the ETH market.

XRP

XRP seems to be recovering from its price crash in the first week of September. The altcoin at the time of writing was trading for $0.242511 with a 0.28% change in its price. Despite being overtaken by Tether, XRP hasn’t lost the fourth position yet as its market cap was recorded to be $10.91 billion.

download 13

The Relative Strength Index marker was seen heading towards the oversold zone.  Nevertheless, a strong selloff sentiment was intact in the XRP market. The Awesome Oscillator hinted at the presence of bulls with green closing bars.

Filed Under: News, Market Analysis Tagged With: altcoin technical analysis, Chainlink (LINK), Ethereum (ETH), Ripple (XRP)

Litecoin, Monero, Stellar Technical Analysis on 11th September 2020

September 11, 2020 by Sahana Kiran

By recording an overall market capitalization of $334.06 billion, the crypto-verse was seen heading towards recovery. While Bitcoin’s dipped to 56.8%, several altcoins were seen prepping to endure potential slumps caused by the presence of bears in the market.

Litecoin [LTC]

As the Litecoin community gears up for the launch of MimbleWimble, the of the altcoin witnessed dainty gains over the past few weeks. However, during the first week of September, LTC recorded a huge slump further pushing its price back into the $40 zone. During press time, the coin was trading at $48.65 with no significant change in its price.

download 7

Parabolic SAR’s dotted markers pushed LTC below a major resistance level of $54. The formation of the dotted line above the candlesticks indicated the prevention of any possible breakout in the upward direction. The Relative Strength Index was also seen lounging in the high sell-pressure zone. If bears decide to prolong their stay in the LTC market, the altcoin might dip below $40.34, which has been a strong support level for LTC.

Monero [XMR]

Similar to every other coin in the crypto-verse, XMR recorded a massive drop in its price back in the first week of September. However, the coin seemed to be on its way to recovery. With a market cap of $1.48 billion, the privacy coin was trading at $83.59. However, at press time, XMR was seen plunging by 2.23%

download 8

Bears seem to be reposing in the XMR market as the MACD line has been below the signal line for a long time now. Even though the bearish crossover took place long ago, both the lines seemed like they would soon converge. The Klinger Oscillator indicator, however, hinted at the presence of bulls in the market. If bulls do take over the XMR market, the price of the altcoin could push past a resistance level at $90.

Stellar [XLM]

XLM began its journey downhill back in August, unlike the other coins. However, the altcoin was seen rising by 2.90% during the time of writing. XLM was trading at $0.0815 with a market cap of $1.68 billion.

download 10

The Awesome Oscillator observed a shift in the momentum, however, the bars were seen turning green after an array of red bars. The Chaikin Money Flow seemed to be headed towards the bearish territory as outflow of capital was indicated in the XLM market. If bears do take over the market, the altcoin might stoop below its critical support level at $0.064.

Filed Under: News, Altcoin News Tagged With: altcoin technical analysis, Litecoin (LTC), Monero (XMR), Stellar (XLM)

Binance Coin, Bitcoin SV, Cardano Technical Analysis on 7th September 2020

September 7, 2020 by Reena Shaw

The cryptocurrency market posted a significant recovery shortly after the weekend bloodshed catapulting the collective market cap to $328 billion. During this time, as several altcoins bounced off close to crucial resistance levels, Bitcoin‘s dominance dropped by 57.6%.

Binance Coin [BNB]

binance coin technical analysis

After posting gains of 17.76% over the last 24-hours, Binance Coin [BNB] was priced at $22.40. At the time of writing, BNB registered a market cap of $3.235 billion and a 24-hour trading volume of $743.20 million.

BNB appeared to be heading for an uptrend targeting the overhead resistance of $24.73 while its value found critical support at $19.48. The red candles of Awesome Oscillator depicted the presence of bearishness in the market. The Chaikin Money Flow value above the zero-line, however, indicated resuming strength in the market.

Bitcoin SV [BSV]

bitcoin sv technical analysis

Bitcoin SV [BSV] underwent a positive price change of 4.44% over the past day, driving its price to $168.32 as it held a market cap of $3.115 billion and a 24-hour trading volume of $1.38 billion.

While the Klinger Oscillator appeared to be heading for a bullish crossover following the latest uptick, however, MACD hinted in no such signs of a comeback. This essentially signaled that the bears have been aggressively defending the resistance area of $202.54.

If the bulls fail to push the price above, BSV could retrace its steps back to the support level of $147.4.

Cardano [ADA]

cardano technical analysis

Cardano [ADA] has breached important support after the subsequent pullbacks and recovery attempts to regain strength appeared to have stalled.

The dotted markers of Parabolic SAR have been resisting a potential upward breach for almost a week. The RSI on the extreme negative end depicted a sentiment of intense sell-off in the ADA market. In case of a trend reversal, a bullish target of the recent breached level of $0.107. If bears continue to have an upper hand, ADA could potentially drop close to its support of $0.0773.

Filed Under: Market Analysis, Altcoin News, News Tagged With: altcoin technical analysis, Binance Coin (BNB), binance coin technical analysis, binance coin tradingview, Bitcoin SV (BSV), bitcoin SV technical analysis, bitcoin sv tradingview, Cardano (ADA), cardano technical analysis, cardano tradingview, cryptocurrency technical analysis

Chainlink, Ethereum, XRP Technical Analysis on 5th September 2020

September 5, 2020 by Sahana Kiran

The COVID-19 pandemic left almost every other market, including the crypto market, crashing to severe lows. However, the crypto industry was evidently faster in terms of recovery compared to several others. While the past two weeks were eventful for the crypto market, it didn’t seem to hold on to the bullish phase for too long. During the time of writing, the entire market was seen turning red, and Bitcoin’s dominance stooped down to 57.1%

Chainlink [LINK]

download 3

LINK was undoubtedly one of the best performing digital assets this year. The altcoin made its way to the top 10 and currently stands as the fifth-largest cryptocurrency with a market cap of $4.75 billion. However, the coin seemed to be following the trail of other cryptocurrencies as it was plummeting by 2.3 percent in the past hour. At press, time the coin was trading for as low as $12.35.

Chainlink’s LINK seems to be making attempts to push past $12.90 which has been a major resistance for the altcoin. The dotted marker of the Parabolic SAR lounged below the LINK candlesticks which prevented any potential downward breakout, further indicating the presence of bulls. However, a strong sell-off sentiment remains intact as the Relative Strength Index marker dropped below 50 median.

Ethereum [ETH]


download 4

ETH turned several heads after it pushed past $400. However, the second-largest cryptocurrency with a $41.8 billion market cap witnessed a 1.6 percent drop in its price over the last hour. This further led to ETH trading at a low of $373.38, during press time.

While the bears continued to guard the resistance level of $400, the price of ETH plummeted below a major support level of $380. Both the MACD as well as the Klinger Oscillator displayed bearish crossover indicating the strong presence of bears in the ETH market.

XRP

download 5

Even though XRP did not endure a massive drop in its price change, the fourth largest coin was trading at $0.2488. While the XRP community has been hoping that the altcoin would move beyond cents, XRP went ahead and fell below a major support line.

The Awesome Oscillator indicator displayed red bars indicating a shift in momentum. Chaikin Money Flow also followed suit as it indicated an outflow of the capital further highlighting the presence of bears, With key indicators revealing signs of a bearish territory, XRP is unlikely to push past the resistance level at $0.260.

Filed Under: Market Analysis, Altcoin News, News Tagged With: altcoin technical analysis, ETH, Ethereum (ETH), Ripple (XRP), xrp

XRP, Chainlink, Bitcoin SV Technical Analysis on 19th August 2020

August 19, 2020 by Reena Shaw

The cryptocurrency market underwent a correction driving the collective market cap to face a major retracement all the way back to $370 billion. After a short-lived tryst above the $12k-mark, Bitcoin was back below the crucial key level. Following suit were several major altcoins such as XRP, bitcoin SV( BSV )& chainlink that recorded minor falls as a result.

XRP

xrp 2 e1597812364567

Despite pushing back and reclaiming the third spot in the cryptocurrency ladder, XRP has so far failed to post impressive gains. The development activity in the XRP network has been decreasing since the beginning of the year.

‘@santimentfeed reveals that the development activity on the $XRP network has been declining since January.#Ripple’s commitment to creating a working product and continuously polishing its features does not reflect the recent announcement about expanding the utility of #XRP. pic.twitter.com/XCyNDI1qCM

— Ali Martinez (@satoshilatino) August 17, 2020

At the time of writing, XRP was valued at $0.295 after a major decline of 6.95% over a period of 24-hours. Its market cap was observed to be at $13.28 billion while recording a 24-hour trading volume of $2.08 billion.

Awesome indicator signaled a bullish trend with its red closing lines depicting the outflow of money from the XRP market. The Chaikin Money Flow was also observed to be struggling in the bullish region.

Chainlink

link 2 e1597812429702

Chainlink has been one of the best performing tokens among the top 10 cryptocurrencies by market cap. However, the latest downturn drove the coin to breach the previously established support level.

LINK was down by 8.78% over the last 24-hours driving the token’s price all the way to $15.67. At the of writing, the sixth-largest crypto registered a market cap of $5.48 billion and a 24-hour trading volume of $2.93 billion.

The MACD indicator appeared to undergo a bearish crossover in the near-term. A potential bearish trend was also observed by the Klinger Oscillator.

Bitcoin SV [BSV]

bs e1597815954135

BSV was the third-largest loser among the top 10 market cap cryptocurrencies in the latest drop. The contentious fork coin hovered below at a key price level of $230. BSV appeared to be struggling to revive its valuation despite developments such as the digital currency security and asset management firm, CYBAVO announcing support for the coin.

At press time, BSV’s market cap stood at $3.90 billion and was priced at $211.3. Over the last 24-hours, the coin fell by 8.36% which drove its trading volume to $950 million.

The dotted markers below the BSV price candles appeared to be supporting the coin’s price from a further dip. The Relative Strength Index [RSI] dropped below the 50-median line depicting a sentiment of selling pressure among the traders in the BSV market.

Filed Under: Market Analysis, Altcoin News, News Tagged With: altcoin market cap chart, altcoin market cap tradingview, altcoin technical analysis, Bitcoin SV (BSV), bitcoin SV technical analysis, Chainlink (LINK), chainlink technical analysis, Ripple (XRP), xrp technical analysis

Chainlink, Litecoin, EOS Technical Analysis on 16th August 2020

August 16, 2020 by Reena Shaw

The collective cryptocurrency market appeared to be in a consolidation phase. The market cap was registered at a whopping $373 billion, a level unseen since May 2018. While Bitcoin has faced multiple rejections at the coveted $12k-level, several altcoins have, however, sprung up in action.

Joining the bandwagon are coins such as Chainlink [LINK], Litecoin [LTC], and EOS, which have witnessed a substantial rise in their values over the last 24-hours.

Chainlink [LINK]

chainlink technical analysis

Chainlink has been in the spotlight for quite some time now and has been one of the best-performing assets among the top coins. As the weekend dawned, LINK soared to a new all-time high. Meanwhile, it recorded a surge of 13.21% over the last 24-hours which catapulted its value to $18.93 at the time of writing.

Moreover, it registered a market cap of $6.64 billion along with a 24-hour trading volume of $2.538 billion.

As the fifth-largest altcoin continued to build on gains, the green closing bars of Awesome Oscillator indicated a positive course for the coin’s price in the near-term. Further exhibiting a bullish trend was the Chaikin Money Flow indicator as it hovered in the bullish territory.

Litecoin [LTC]

litecoin technical analysis

Over the past year, Litecoin fell to the eighth position. After subsequent downfalls, LTC appeared to be slowly moving ahead and targeted a local top. At press time, the cryptocurrency noted a market cap of $4 billion with a 24-hour trading volume at $3.28 billion. LTC was being traded at $61.41 and was up by 6.91%.

The indicators failed to back up the latest surge in the coin’s valuation. This was evidenced by the bearish Klinger Oscillator. After a brief tryst with the bears, the MACD appeared to be heading for a bullish crossover.

EOS

EOS technical analysis

Despite not much significant developments on the tech side, EOS was the second-best performing asset in the last 24-hours among the top 20 coins, trailing behind LINK. It was up by 11.12% over the last 24-hours which drove its price to $3.75, at the time of writing. Furthermore, EOS recorded a trading volume of $5.12 billion over the past day while its market cap stood at $3.50 billion.

The dotted markers of Parabolic SAR hovering below the EOS candles depicted a bullish phase for the tenth-largest coin. Following the latest upsurge, the Relative Strength Index [RSI] shot up to the overbought region. This could essentially lead to a decline in demand among the traders of the coin with a subsequent decline in its price in the near future.

Filed Under: Market Analysis, Altcoin News, News Tagged With: altcoin technical analysis, Chainlink (LINK), chainlink technical analysis, EOS, EOS technical analysis, Litecoin (LTC), litecoin technical analysis, Price Analysis

Primary Sidebar

Recent Posts

  • Chainlink [LINK] Surges Close To $30; Eyes At A Relief Rally March 3, 2021
  • Coinbase Custody Accrued 11% of Collective Crypto Capitalization In 2020 March 3, 2021
  • After Mary Hard Fork, Cardano Is Now A Multi-Asset Blockchain March 2, 2021
  • CryptoGames –Spectacular Games, Invulnerable Security, Swift Transactions and Much More! March 2, 2021
  • Google Finance Adds ‘Crypto’ Tab featuring Bitcoin, Litecoin, Ethereum, Bitcoin Cash March 2, 2021


Footer

News

  • Altcoin News
  • Bitcoin News
  • Blockchain
  • Tron News
  • World

Digest

  • Meet the Founder
  • Price Winning Article
  • DeFi
  • Cyber Security
  • Crypto Scam

Industry

  • Project Review
  • Technology
  • Fintech
  • Tron Exchange
  • New in Town

Tron Universe

  • Event and Tron Parties
  • New in Town
  • Tron Tokens

Follow Us

Subscribe US

Copyright © 2021 · Tron Weekly. All Rights Reserved. NOTE: Tron Weekly is an independent crypto news site that adheres to the strict journalism policy anchored on transparency, trust, and objectivity, we have no affiliation with the TRON Foundation, its founder Justin Sun or any other cryptocurrency firm.