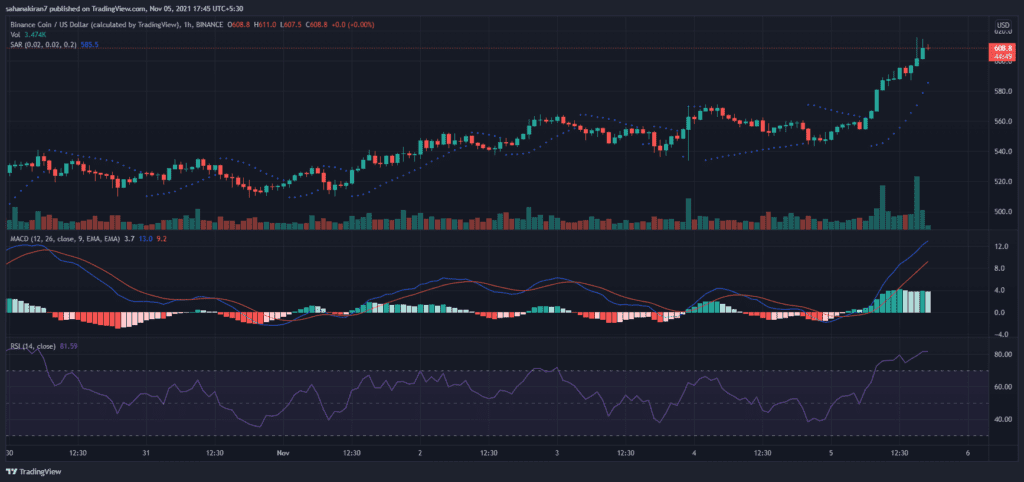
The native coin from Binance Coin(BNB) Chain, originally known as BSC, had a 50% increase in price towards the end of 2021, but a significant decline in 2022. For instance, on February 26, 2024, the value of a single BNB coin was around 388.56 US dollars, a significant decrease from its all-time high of 600 US dollars in November 2021. All the same, Binance Coin was among the top 10 priciest cryptocurrencies in 2022. It’s interesting to note that the price increase of BNB in November 2021 matches a comparable price shift for Ethereum (ETH), a cryptocurrency that BNB first appeared in 2017 before emerging on its own a few years later.
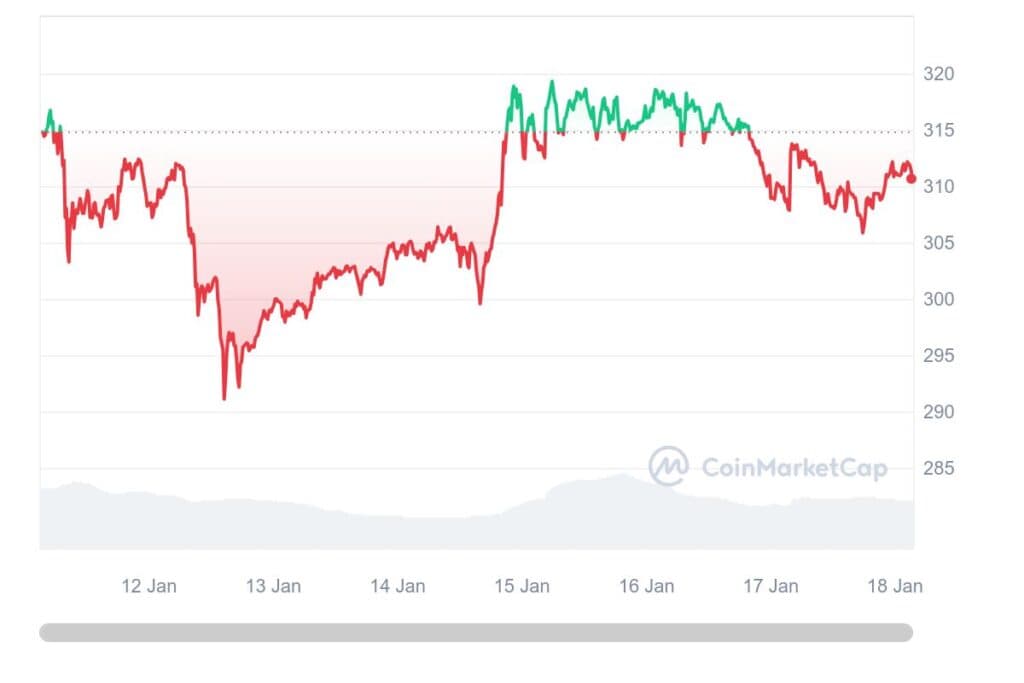
After facing legal issues and CZ resigning as CEO, Binance’s own cryptocurrency, BNB, surged to above $380, its highest level since November 2022, inspiring optimism among investors. According to CoinMarketCap data, BNB peaked at $386, a 7.70% increase over the previous week, making it the fourth-largest cryptocurrency by market capitalization.
The majority of market watchers credit the spike to a change in public opinion of BNB following Binance’s settlement with US authorities. Given that BNB’s sharp increase above $400 contrasted with Bitcoin’s stalemate above $56,000, the leading exchange token is ready to shortly retest important upper resistance levels. As bullish momentum picks up speed, Binance Coin is currently trading at over $400, up 30.6% in only the previous thirty days.
Examining Binance Coin’s Price Surge
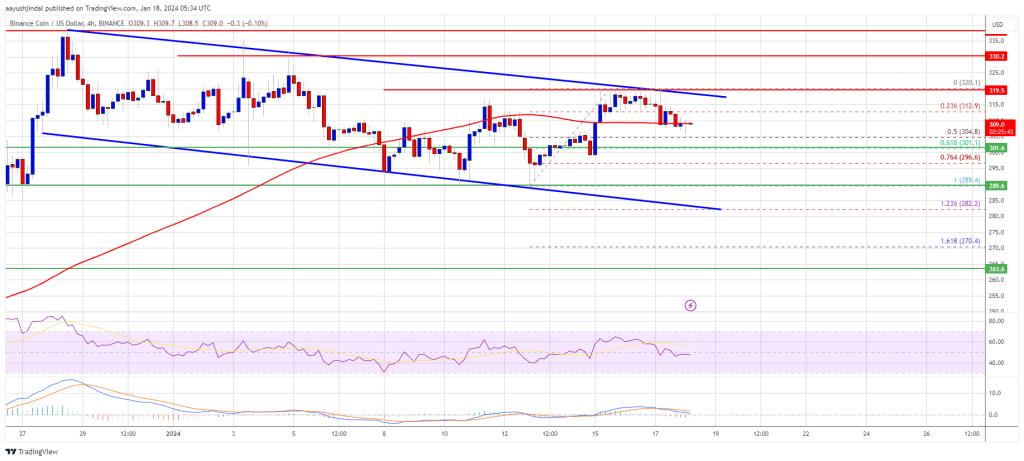
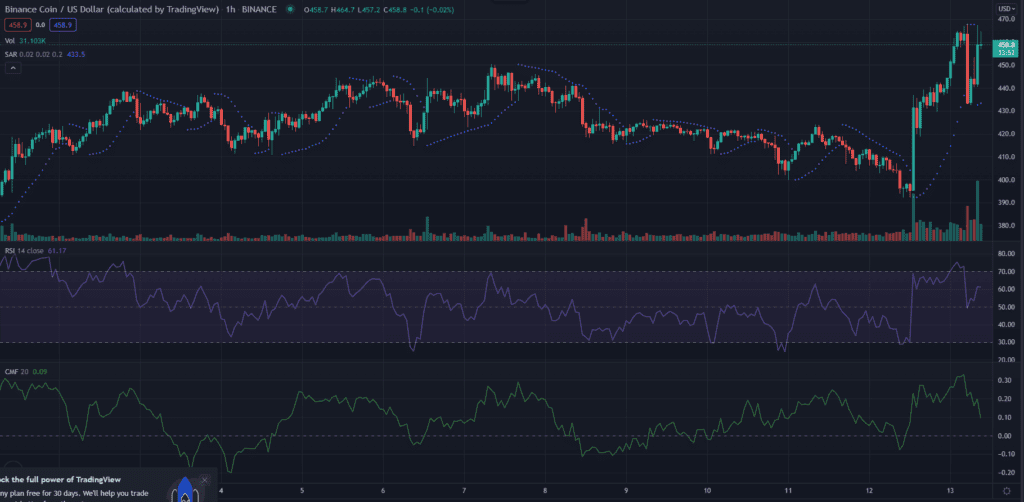
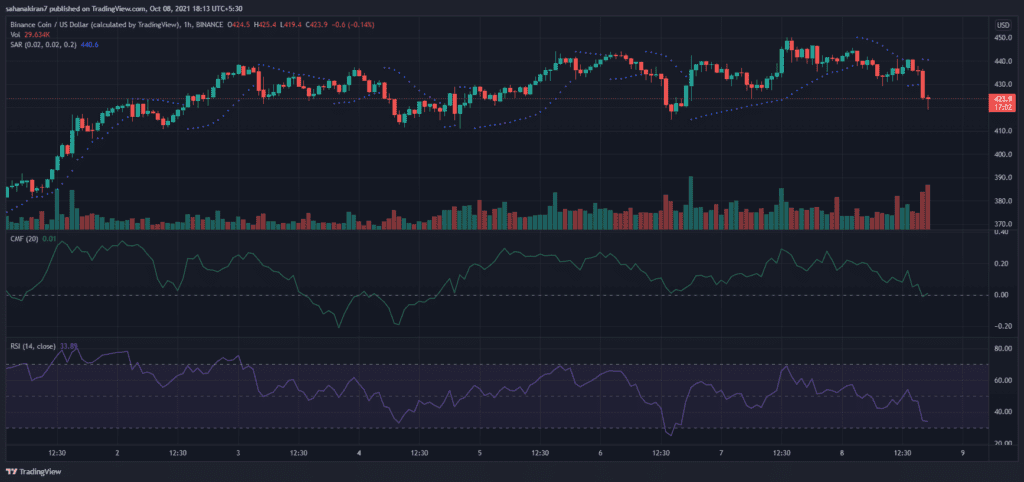
Over the past day, there has been a 1.07% gain in the rate of Binance Coin (BNB). The price of BNB appears to be more bearish than bullish on the hourly chart because it is close to the local support level of $395.5. One can anticipate a breakout and a move to the $390 region if the circumstances do not improve by the end of the day.
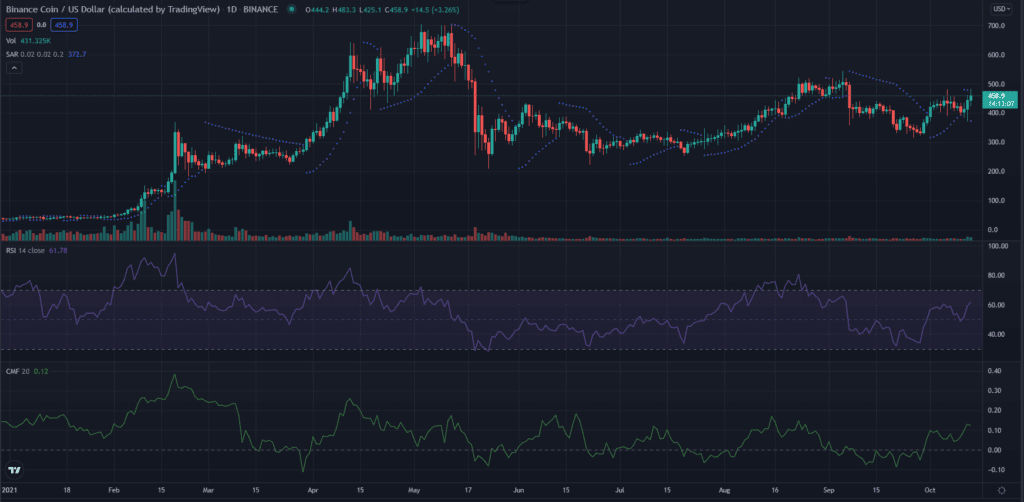
Not so long ago, BNB crossed the important psychological $400 mark. This discovery could trigger FOMO, or the fear of missing out, and push BNB back up to its former all-time highs of over $690. Experts in cryptocurrency from Changelly have offered their price prediction for Binance Coin for the next weekend, taking into consideration BNB’s performance from earlier in 2024. The coin is expected to reach an average price of $420 throughout this period.
The lowest price expected to occur is $416, and the highest targeted price is $440. Though investor confidence was shaken by earlier worries about the Binance exchange last year, BNB appears to have rekindled the strong underlying story that has backed it since its founding.