Bitcoin has entered a pivotal phase known as “expansion,” according to Charles Edwards, founder of Capriole Investment. This transition, characterized by strong on-chain fundamentals, is reminiscent of conditions observed prior to historical price surges in Bitcoin’s valuation.
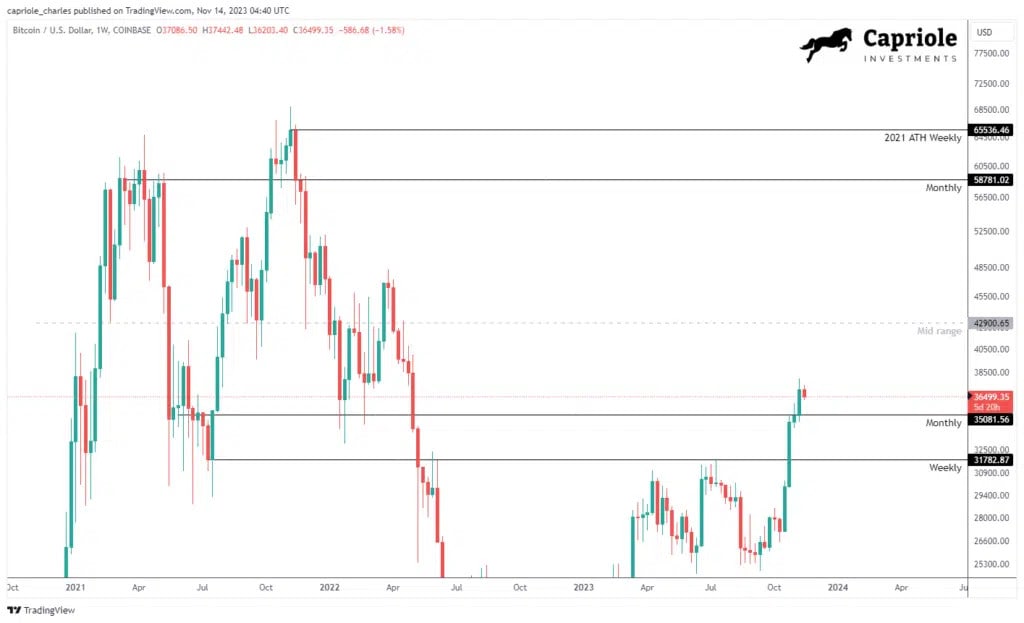
Bitcoin recently surged from $34,000 to $38,000 swiftly, encountering some resistance and currently stabilizing around $36,500. Notably, it has surpassed key resistances on the chart, consistently closing above weekly and monthly levels, specifically the $35,000 mark, for several days. This places high-timeframe technical indicators in a robust position.
Simultaneously, Bitcoin’s Macro Index indicates an “expansion” in on-chain fundamentals. This marks the return to fundamental expansion for the first time since November 2020. The convergence of critical technicals and fundamentals signals a major milestone, with the risk-reward ratio heavily tilted towards the upside. However, in the short term, the outlook is mixed, as derivative markets are currently overheated, and low timeframe technicals suggest a possible minor retracement.
Bitcoin Technicals by Timeframes
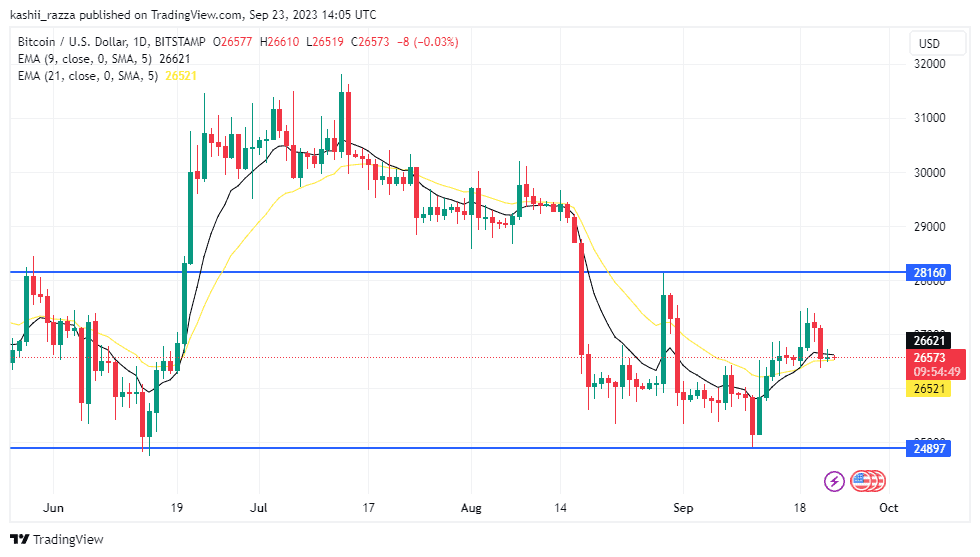
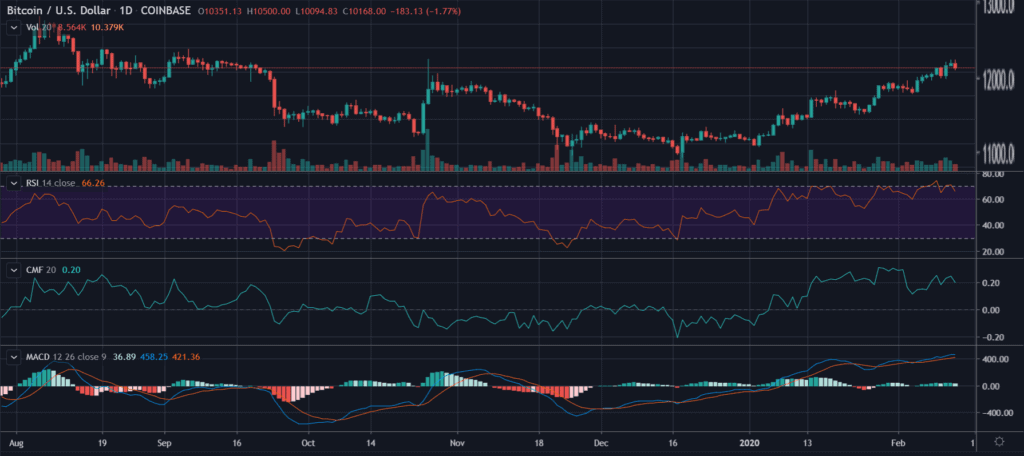
Examining the high timeframe technicals, the recent breakout into the 2021 range presents the most favorable setup in years. As long as $35,000 holds on weekly and monthly levels in November, the next substantial resistance lies in the range of $58,000 to $65,000.
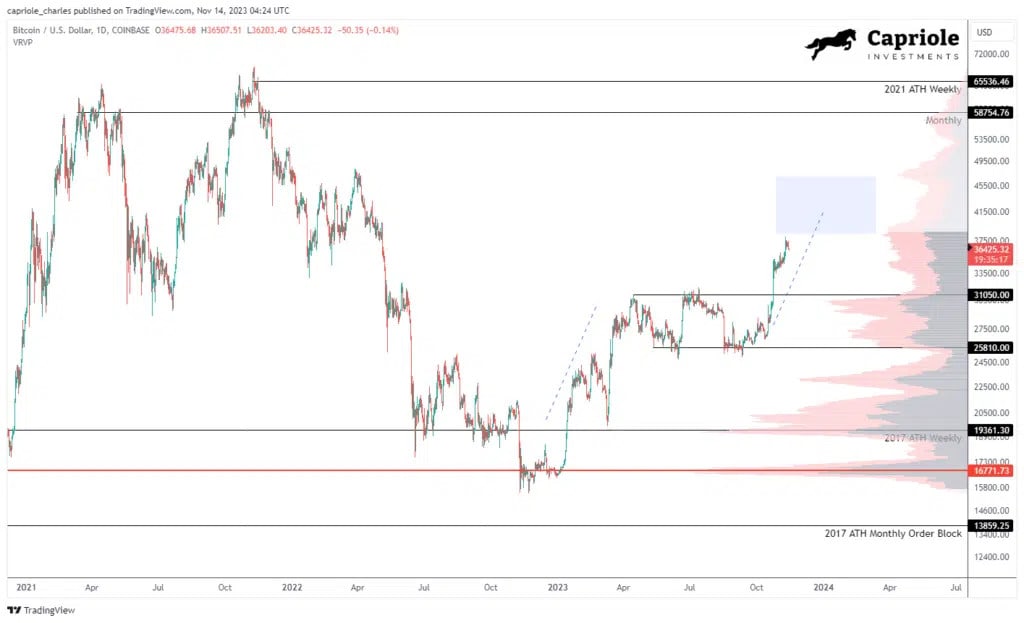
On the low timeframe, the anticipated measured move following the Wyckoff Accumulation is nearly complete, with an expectation of the breakout leading into the $40,000s.
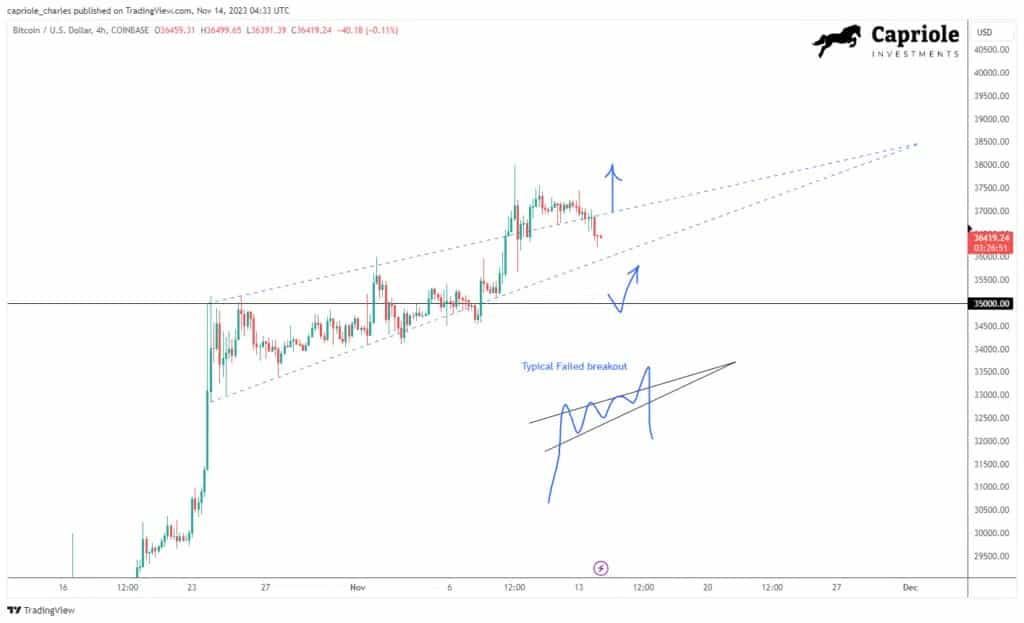
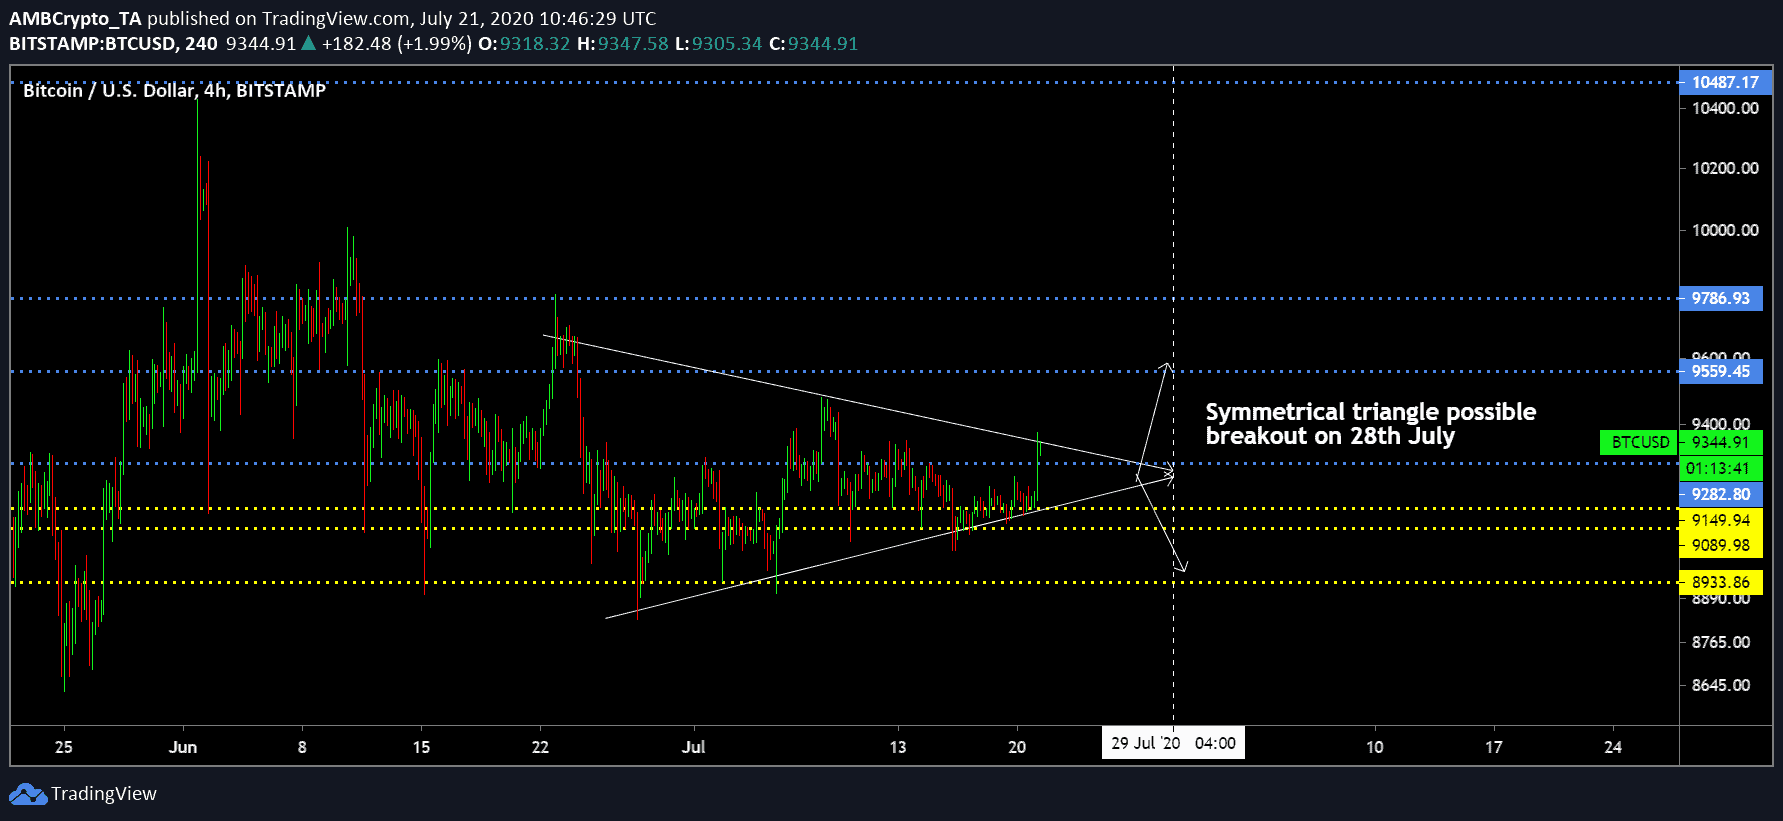
Zooming in on the 4-hour timeframe, a ‘failed breakout’ within a rising wedge pattern is observed. As long as Bitcoin remains below $37,000, revisiting $34,000 to $35,000, which serves as high timeframe support, could present a favorable long opportunity.
Bitcoin Macro Index: Fundamentals and Risks
Fundamentals and on-chain data play a pivotal role in assessing probabilities during crucial market shifts. Capriole’s Bitcoin Macro Index, combining over 40 influential metrics into a single machine learning model, offers a fundamental-only value investing approach to Bitcoin. Edwards emphasizes that price isn’t an input in this model.
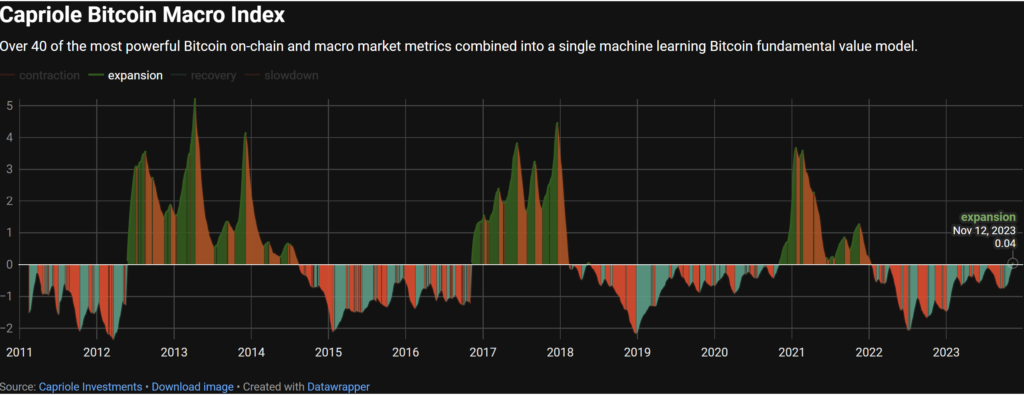
The Bitcoin Macro Index illustrates that fundamentals have been growing rapidly in the last two weeks, crossing into the expansion phase. This transition historically precedes significant price surges, making it an opportune time for allocation, according to Edwards.
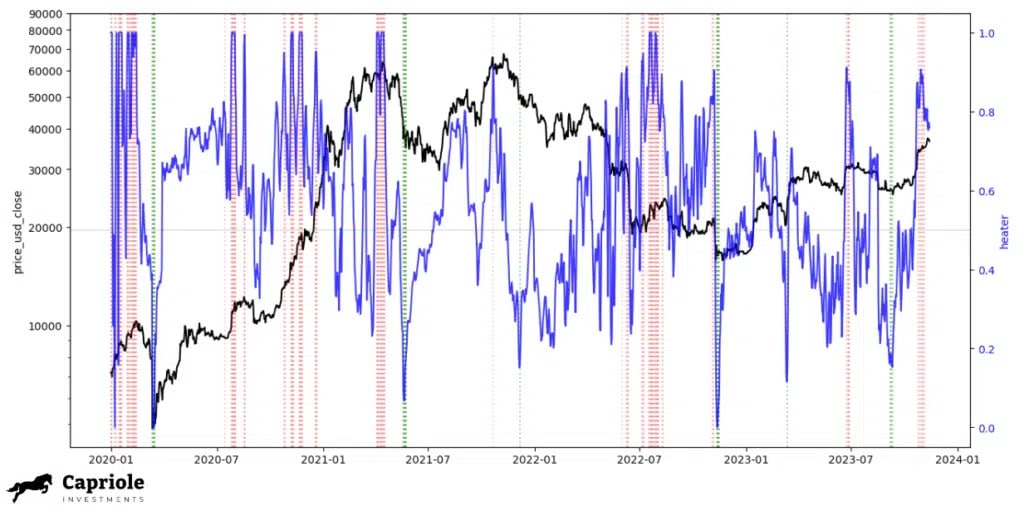
The analysis includes a metric that aggregates Perpetuals, Futures, and Options markets, weighing them by their Open Interest to gauge the entire derivatives market’s risk. Edwards acknowledges potential risks indicated by this metric but emphasizes that it should be considered in the broader context, especially given the optimistic fundamentals suggested by the Capriole Macro Index.
Edwards notes that if Bitcoin maintains support at $35,000 and on-chain fundamentals continue to grow, the market is poised for promising opportunities. While potential red flags on low timeframes and in the derivatives market exist, they are expected in the evolving bull run and may present lucrative opportunities if they materialize.
Note: The details on this page about markets and instruments are like a sneak peek – just info, not a nudge to buy or sell. Before diving into investments, dive into your own research pool.
Related Reading | Turkey Unveils New Crypto Regulations Amidst Global Scrutiny
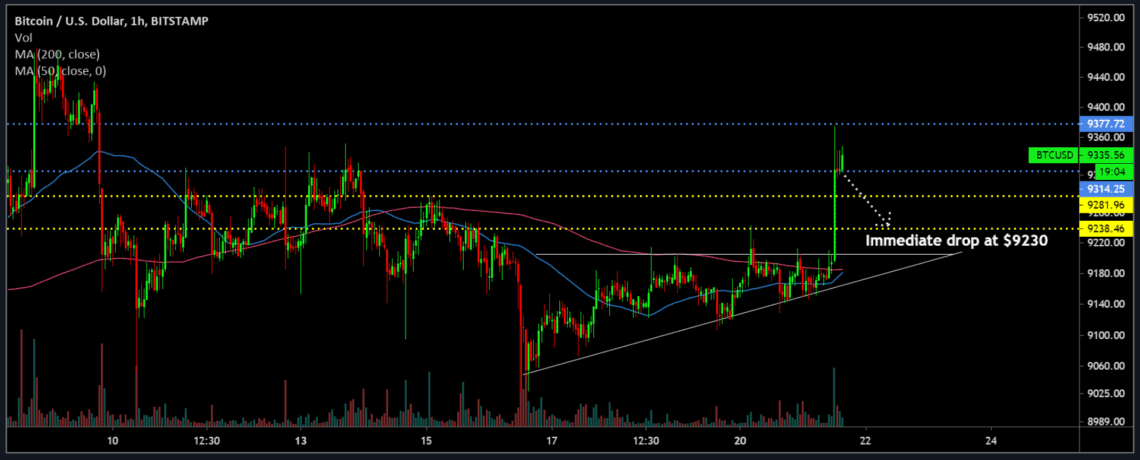
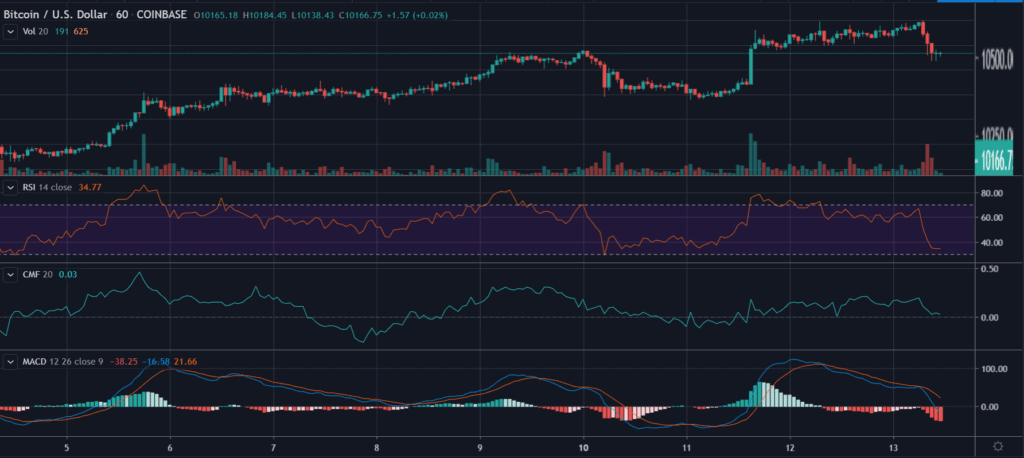
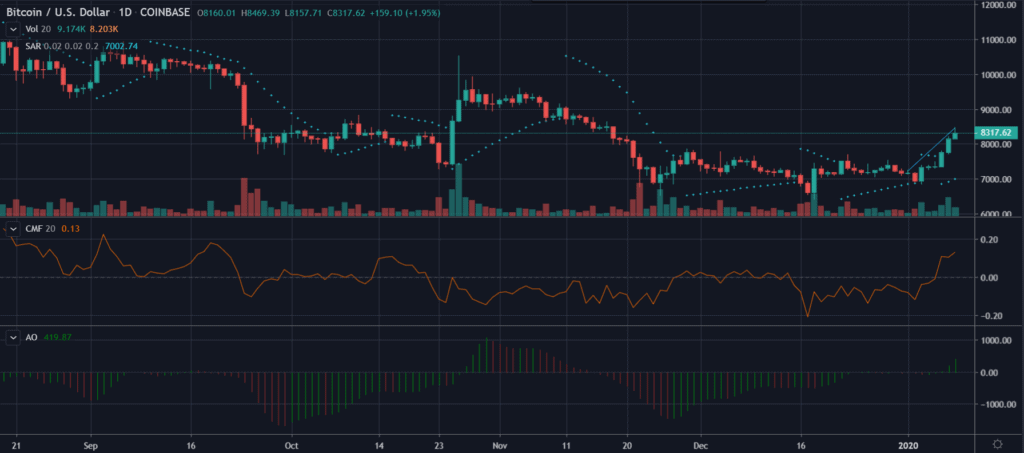
![Bitcoin [BTC/USD] Price Analysis:](https://www.tronweekly.com/wp-content/uploads/2020/01/btc-1-hr-1024x482.png)