• Skip to primary navigation
  • Skip to main content
  • Skip to primary sidebar
  • Skip to footer

TronWeekly

Crypto World News

  • Home
  • Education
    • Best TRON Wallets
    • Beginner’s guide to TRON
  • Opinion
    • Tron Tokens
    • Market Analysis
  • Industry
    • Tron Exchange
    • Project Review
  • Press Release
  • Advertise
  • About us
    • The Team
    • Editorial Policy
    • Write for us
    • Privacy Policy
    • Disclaimer
    • Terms and Conditions
    • Contact
You are here: Home / Archives for BTC/USD

BTC/USD

What Happens Next for Bitcoin After CPI Rates Lower Than Expected?

April 14, 2023 by Mohammad Ali

CPI (The Consumer Price Index) data, which was much anticipated, was released yesterday, and it has been a wild week for the Bitcoin market. Although the CPI was lower than expected, which suggests that inflation has slowed, the market reaction was anything but steady. Although Bitcoin (BTC) was able to retake the $30,000 mark, the issue of whether it will keep rising or whether a correction is approaching continues to rise.

Will Bitcoin see new highs or a correction After CPI is Rated?

Although the report’s CPI rate of 5.0% was less than the 5.2% that many had predicted, Bitcoin’s recent price increase and momentum seem unimpressive. Although BTC’s climb may continue, the cryptocurrency is having trouble stabilizing above the $30,000 level.

The core CPI, which includes food and energy expenses, has climbed from the previous month despite the lower-than-expected CPI rate of 5.0%, suggesting that inflation may not be dropping as soon as anticipated.

In a recent newsletter, prominent crypto analyst Michael Van de Poppe pointed out the remarkable performance of Bitcoin compared to other assets. As a result, other cryptocurrencies in the industry have underperformed.

BTC’s sideways price action on the 1-day chart. Source: BTCUSDT on TradingView.com

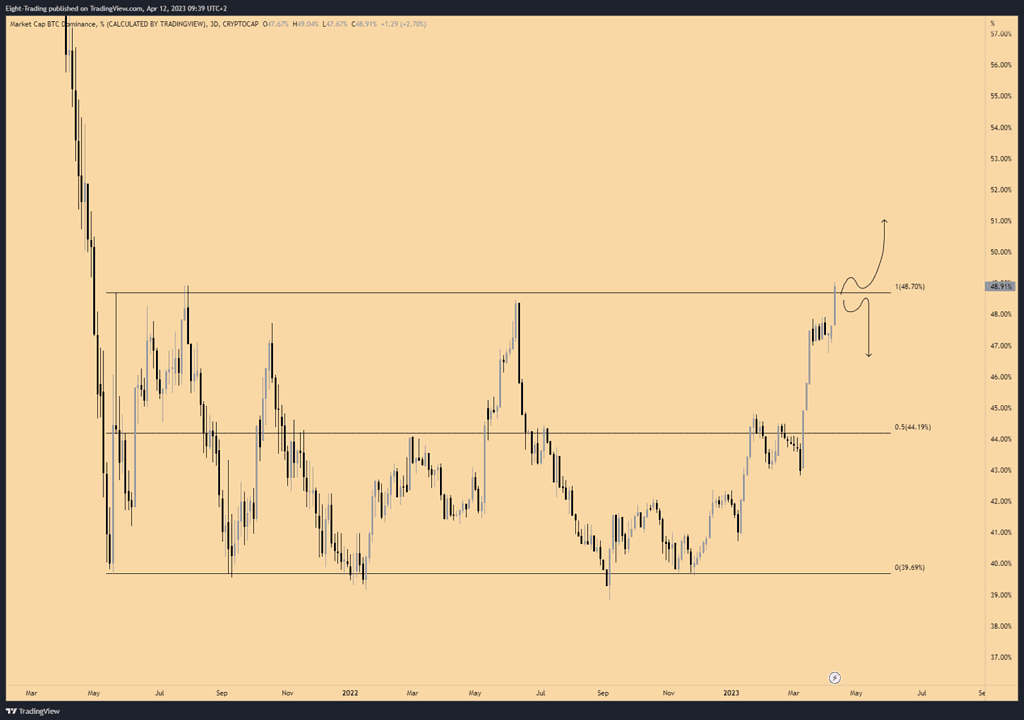
The BTC.D chart over a 2-day period has been highlighted by Van de Poppe as being at a crucial phase. If there is a good breakout and BTC enjoys a positive continuation after a retest of the range high, he says that Bitcoin’s strength might continue to rise. On the other side, if the market exceeds the range and then drops back into it, it can offer chances for alternative currencies to acquire traction.

in Bitcoin’s price between $28,400 and $28,800 might have a  favorable effect on the cryptocurrency’s total price movement. As it was once a formidable barrier to cross but is now an important threshold for BTC, this specific zone may act as a strong support level.

At the time of writing, Bitcoin is trading at $29,950 and has dropped slightly by 0.8% over the last day due to sideways movement. BTC might restore its bullish momentum and hit a new yearly high, though, if it can weather a potential retreat into the $28,600 region.

On the other side, if BTC is unable to hold its position and breaks through this level, it may continue to retrace its path toward the $27,200 region. This level could be important since a strong recovery from it might support the consolidation of Bitcoin over $30,000.

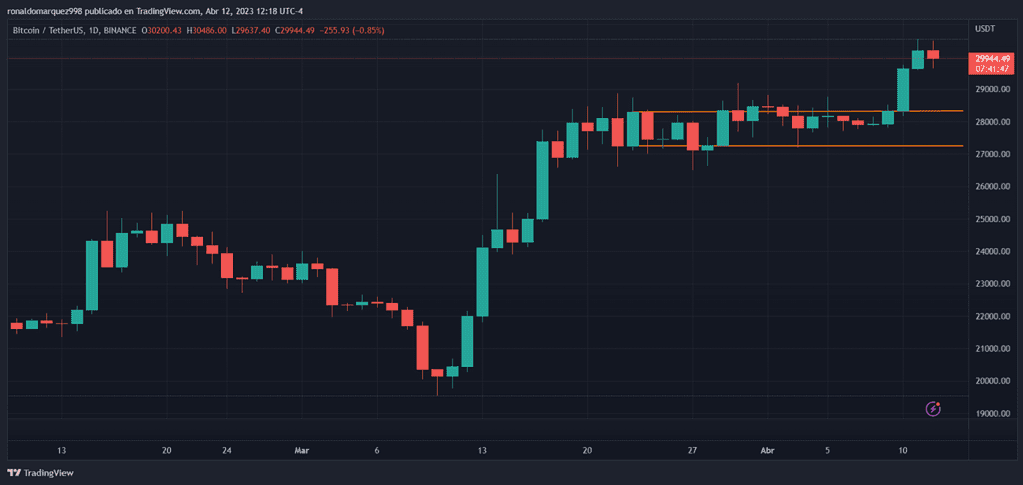
Chart from TradingView.com; featured image from Unsplash.

Related Reading: | Bitcoin & Ethereum Prices Rise After Us CPI Falls Short Of Expectations |
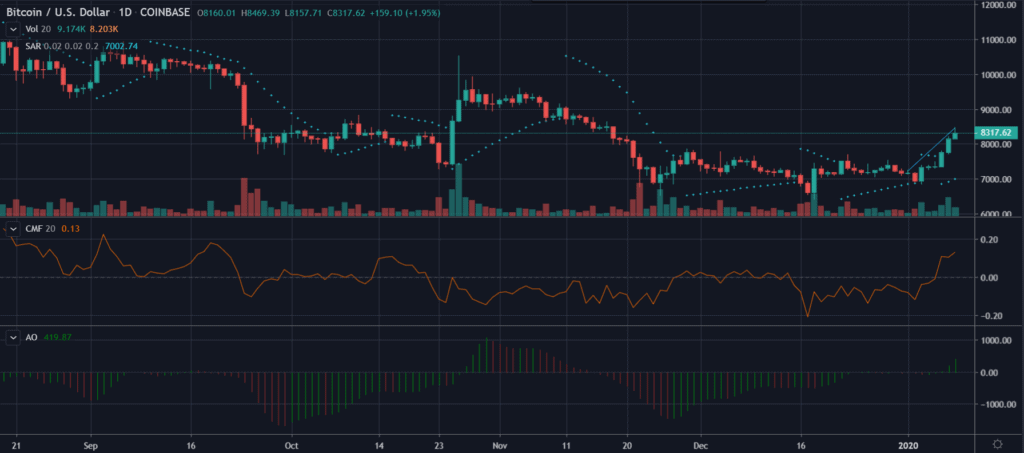
Filed Under: News, Altcoin News, Bitcoin News, Blockchain Tagged With: Bitcoin (BTC), Blockchain, BTC/USD, Crypto, Crypto Adoption, Cryptocurrency

Bitcoin ATMs and Their Impact in the BTC Push

March 25, 2023 by Akash Anand

Bitcoin ATMs have become increasingly popular over the years, offering users a fast and easy way to buy and sell Bitcoin. In this comprehensive guide, we will explore everything you need to know about Bitcoin ATMs, from how they work to their advantages and disadvantages.

What is a Bitcoin ATM?

A Bitcoin ATM is a self-service machine that allows users to buy or sell Bitcoin using cash or debit card. These ATMs are connected to the internet, providing a quick and convenient way for users to purchase Bitcoin without the need for a traditional exchange. Bitcoin ATMs have a similar appearance to regular ATMs, but they do not dispense cash. Instead, they dispense Bitcoin. Some Bitcoin ATMs even allow users to buy crypto with prepaid Visa cards.

How do Bitcoin ATMs work?

Bitcoin ATMs work in a similar way to traditional ATMs, but with a few key differences. To use a Bitcoin ATM, you will need to have a Bitcoin wallet installed on your mobile device or a paper wallet. When you arrive at the Bitcoin ATM, you will need to select the “buy” or “sell” option and enter the amount of Bitcoin you wish to buy or sell.

If you are buying Bitcoin, the ATM will generate a QR code that you can scan with your mobile device to send the Bitcoin to your wallet. If you are selling Bitcoin, you will need to send the Bitcoin to the ATM’s address, and the machine will dispense the cash.

Advantages of Bitcoin ATMs

Bitcoin ATMs offer several benefits, with convenience being one of the biggest advantages. These ATMs enable users to quickly and easily buy and sell Bitcoin without having to use a traditional exchange. Additionally, Bitcoin ATMs are available around the clock, making it possible for users to buy and sell Bitcoin at any time, day or night.

Another advantage of Bitcoin ATMs is their ability to provide users with anonymity. Unlike traditional exchanges, Bitcoin ATMs do not require users to provide personal information, such as their name or address. This makes Bitcoin ATMs a popular choice for users who value their privacy and want to keep their personal information confidential. In fact, some Bitcoin ATMs even allow users to buy bitcoin with prepaid Visa cards, adding an extra layer of privacy and convenience.

Disadvantages of Bitcoin ATMs

One of the main disadvantages of Bitcoin ATMs is their high fees. Bitcoin ATMs charge higher fees than traditional exchanges, which can range from 5% to 10% per transaction. This is because Bitcoin ATMs need to cover their operational costs, such as rent, electricity, and maintenance.

Another disadvantage of Bitcoin ATMs is their low transaction limits. Most Bitcoin ATMs have a daily transaction limit of $10,000, which can be a problem for users who wish to buy or sell large amounts of Bitcoin.

Conclusion

Bitcoin ATMs are a convenient and easy way to buy and sell Bitcoin, but they do come with some disadvantages, such as high fees and low transaction limits. Before using a Bitcoin ATM, it is important to do your research and understand the fees and limits associated with the machine. Overall, Bitcoin ATMs offer a fast and convenient way for users to buy and sell Bitcoin, and they will likely continue to grow in popularity as the cryptocurrency market expands.

Filed Under: Press Release Tagged With: atm, Bitcoin, BTC/USD

Bitcoin Usurps Charts To Become Best-Performing Asset In Last 10 Yrs

March 15, 2021 by Chayanika Deka

Bitcoin [BTC] has created a niche for itself over the past. Exceeding the $1.3 trillion market cap has been another crucial milestone for the digital asset in the backdrop of massive institutional support.

Despite the fact that the crypto-asset underwent a correction from over $61,000 to a modest $57,680, in less than 24-hours, the technicals have never been more positive and have aided in triggering a buying season. On the derivatives side as well, trade volume in Bitcoin options was found to be surging steadily consistent with the trade volume on spot and derivatives exchanges.

Bitcoin Vs Other Assets

With its monumental rise above $60K, Bitcoin has now usurped the charts to become the best-performing asset in the last decade. Since 2010, the crypto-asset registered an average annualized return of 230%. With this, it became the only asset in the charts to have noted triple-figure gains. The only other year Bitcoin did not experience at least a triple-figure gain was in 2019 where it recorded a surge of 95% over the year.

Notably, in the year 2013, it saw a massive 5507% increase.

The data was published by Charlie Bilello, Founder and CEO of Compound Capital Advisors in his latest tweet:

Asset Class Returns over the Last 10 Years…

Data via @ycharts pic.twitter.com/yRvdkIX1BV

— Charlie Bilello (@charliebilello) March 13, 2021

Bitcoin has defeated all the other asset classes by at least a factor of 10. In doing so, it surpassed the US Nasdaq 100 Index which recorded an average annualized return of just 20%.

Trailing far behind in the chart of the last decade were the shares in the US-headquartered companies with market caps more than $10 billion, i.e., US Large Caps has generated an average annualized return of 14%. US Small-Cap stocks followed suit with just a 12.9% annualized return for the past ten years.

Other asset classes projected single-digit returns over the same time period. The precious metal, Gold, for instance, stood at an average annual return of just 1.5% in the last decade as opposed to Bitcoin’s stunning three-digit gains. While Bitcoin’s price recorded 109% YTD gains, Gold stood in the red with a net loss of 9.5%.

Filed Under: Bitcoin News, News Tagged With: Bitcoin (BTC), BTC/USD, Gold, Nasdaq

Here’s Why Selling Bitcoins Now Is A Bad Idea

March 14, 2021 by Chayanika Deka

Bitcoin is unstoppable. It has been generating quite a buzz as it created history by rallying above $60K. With the fresh move up, the cryptocurrency climbed to a market cap of $1.38 trillion and was currently sitting at dominance of 62%. It was particularly interesting because it marked the anniversary of the Black Thursday crash when the price of the crypto-asset fell to $3,800 on the 12th of March.

Exactly one year, 39.95% of the addresses in the money, according to ITB’s chart. Fast forward, to today, 100% of the addresses are in the money.

After shattering the record high, Bitcoin was up by more than 21% over the last week and was currently trading above $61,000. With the latest bullish price action, the cryptocurrency has now entered price discovery. Despite the mad rush from the buyers, some metrics depict that the token has not yet reached its peak.

As noted by Rafael Schultze-Kraft, the on-chain data analyst and CTO of Glassnode, BTC’s NUPL [Net Unrealized Profit/Loss] remained to be in the stable zone even as the price surged. He explained that a stable NUPL depicted that the coin’s market cap was not observed to increase at an excessively faster rate than profit taking and new capital inflows.

“Not the top, we haven’t even crossed .75 into the greed/euphoria zone.”

This was indicative of a healthy ecosystem.

Bitcoin’s Market Dynamics

Bitcoin is at the receiving end of more adoption than ever before. Hence, several fundamentals look great for its future. With respect to user profitability and HODLing sentiment, as well, Bitcoin’s buying pressure has fueled massive outflows from crypto exchanges.

The price rally comes at the backdrop of continuous decline in BTC exchange supply as depicted by crypto-analytic platform, Santiment’s chart below. To top that, the Bitcoin dormant tokens are also on the move as the whales are booking profits while novice and young retail investors are in full-on accumulation mode.

Bitcoin’s price tumbled causing a market-wide ripple effect back in Feb. For the past several weeks, it was not just the cryptocurrency industry that witnessed a slew of correction and sideways trading, Stocks paled in the market too before rising again in the last seven days. President Joe Biden signing the astonishing $1.9 trillion stimulus program into law has further strengthened Bitcoin’s case.

As it continued to carve out fresh records, several notable personalities are eyeing Bitcoin hitting $100,000 by year-end. One such Bitcoin bull is Anthony Scaramucci, the founder of investment firm SkyBridge Capital while speaking with business network’s Squawk Box.

It can be safely stated that the market would now expect volatility. However, a landing of $100k levels for the third quarter might actually come true. Firstly, because there is no promising resistance above the current level. Secondly, institutions are in no mood to stop pouring capita in to the BTC market.

Filed Under: Bitcoin News, News Tagged With: Bitcoin (BTC), BTC/USD

Larger Bitcoin Wallets Are Shuffling Supply

February 23, 2021 by Chayanika Deka

One of the most promising trends that Bitcoin has witnessed was its corporate balance sheet acquisition, with MicroStrategy at the tip of the spear. But the latest market movement proved to be the biggest and the most damaging correction that Bitcoin sustained in its lifetime.

The crypto-asset lost $200 Billion in just 24-hours following panic among the retail traders.

Bitcoin Accumulation Wallets Hit Reversal

Leading up to this event was the peculiar activity from the large wallet holders who were found to have been shuffling supply. As noted by the blockchain intelligence firm, Glassnode, wallets with 1k to 10k Bitcoin holdings appeared to be ‘reducing holdings’.

This is in a clear reversal in the accumulation trend by these high-profile wallets which had been in accumulation throughout 2020. But this class of BTC holders saw a perfect inverse in 2021.

According to the weekly report by Glassnode, Whales saw a supply increase in January of around +80k BTC and a subsequent decrease in the supply of -140k BTC in February.

It is important to note how the supply changes for the 100 to 1k BTC class [purple] and1k to 10k BTC,[(green] is mirrored in volume and shape.

Upon closer inspection, it was found that when one class saw an increasing volume, the other saw a decreasing volume and vice-versa. Hence, large vertical changes in charts like this often represent that a few large entities [example: exchanges, whales, or miners] making internal transactions.

The latest wallet behaviour could, in fact, signify that a sizeable portion of these coins may not be sold, but instead being restructured in custodial wallets. Along the same line, Glassnode noted,

“There was a preference for 1k to 10k wallets in January that are now transitioning into larger sets of UTXOs with smaller denominations between 100 and 1k. Perhaps coins are being placed into multi-signature schemes or custodians are undertaking internal shuffling to meet client requirements.”

Furthermore, the balance held by accumulation addresses continued to remain in a steadily upward direction which suggested long-term ‘HODLer heuristics’. The fact that these wallets saw no spends further validated the above argument.

That being said, while it is no secret that these Bitcoins are on the move and larger balances are being reclassified, it, however, does not necessarily demonstrate an end to, as Glassnode said, “whale spawning season”.

Filed Under: Bitcoin News, News Tagged With: Bitcoin hodlers, Bitcoin Whales, BTC/USD

Did Bitcoin’s Current Bearish Rally Began During “Positive Q2 2020”?

July 11, 2020 by Utkarsh Gupta

The second quarter of 2020 has been extremely tumultuous. Bitcoin  and the rest of the crypto market initially put their right foot on the gas and the market exploded. According to data provided by Binance Research, BTC USD was up by 42% in Q2 2020, making it one of the best quarters in recent coin history.


bitcoin 2020

Other altcoins were also able to take advantage of the rally, with the likes of Ethereum, Bitcoin , and Litecoin sustaining significant gains. Correlations between the various crypto assets had also remained high in the charts, but slightly lower compared to Q1. The 90-day rolling correlation between the S&P 500 and the BTC was positive. But its influence decreased dramatically after mid-June.

Despite major positive moves by BTC USD, Binance’s report noted that it was crucial to note that almost all of BTC USD’s gains came in the first 45 days of the quarter. Referring to it as a “Kangaroo market,” the market environment was divided between the period when prices were going up and the period when prices were falling.

Now, although many supporters have liked to believe that current market stagnation and decline is due to recent market inactivity, the above data may suggest that Q2 2020 was not entirely positive.

Did Bitcoin ‘s current bearish picture start after mid-May?

Let us have some of the facts right. BTC USD’s last high occurred at the end of May when Bitcoin reached $10,250. From here on, the asset’s inability to breach $10,000 was rightly questioned, but the reason is that Bitcoin cash was halved on 11 May. Casual viewers hoped for a bullish rally right after the halving, but it has historically been identified that the BTC usually follows a prolonged correction for the first 6 months after the halving.

It is therefore not inaccurate to state that Bitcoin’s 42 percent positive return in Q2 2020 was down to the hype of the pre-halving. After the halving has been completed, Bitcoin cash is now following its historic past, and the underlying bearish trail is something that was triggered in the midst of Bitcoin’s bullish Q2 period.

Ethereum performed better in Q2 than BTC USD

The report further added that amidst Bitcoin’s stronghold, Ethereum consistently out-marched BTC with a quarterly return of approximately 70 percent in the charts. Major factors behind ETH’s rally has been down to the growth of DeFi and the anticipation surrounding Ethereum 2.0.

Now, with the commencement of Q3 2020, it will be interesting to see the development of the crypto market over the next three months; whether the bearish grip is broken towards the end of the year or not.

Filed Under: Bitcoin News, News Tagged With: Bitcoin (BTC), Bitcoin 2020, Bitcoin halving, BTC/USD, Crypto Market, Ethereum (ETH), Etherium

Bitcoin [BTC/USD] Price Analysis: Price booms as 2020 continues to shower its fortunes

January 8, 2020 by Akash Anand

Bitcoin [BTC/USD] Price Analysis: Price booms as 2020 continues to shower its fortunes


Bitcoin [BTC/USD] Price Analysis: Bitcoin‘s performance in 2020 has been the talk of the cryptocurrency town and many naysayers have now begun to backtrack on their comments about the digital asset’s fall.

The second week of 2020 has been quite fruitful for Bitcoin as its price hit its highest point since November of 2019. This event has been quite clamorous for the space as multiple proponents came forward to praise the world’s largest cryptocurrency.

At press time, Bitcoin’s price was $8293.33 with a total market cap of $150.51 billion. The market cap too has risen to one of its biggest markers since last October, another win for the currency. It is easy to say that the price rise has been random but a technical analysis will give us a deeper look.

1 hour:

Bitcoin [BTC/USD] Price Analysis:
1-hour Chart
The hourly chart for Bitcoin’s price showed multiple green candles shooting for the sky. The immediate price support for Bitcoin was lifted to $7762 after a continuous price hike for 6 days.

The Parabolic SAR was strongly below the price candles. This indicated that Bitcoin’s price would continue to stay in the bullish territory.

The Chaikin Money Flow indicator was another friend to Bitcoin’s price. The CMF was way above the zero line which meant that the capital coming into the Bitcoin market was much more than the capital leaving the market.

The Awesome Oscillator was showing burgeoning green signal after the recent bullish run. The bump in the AO meant that the Bitcoin market pressure was at a long term high.

The short term indicators all showed bullish signs, which may indicate a strong bull run for the next couple of days including a mix of price flatlines.

1 day:

Bitcoin Price Analysis:
1 Day Chart


Bitcoin’s daily price chart had begun to reflect the currency’s performance in the short term. The green candles had begun to take over with the last 6 markers staying green throughout. The immediate support on the daily chart was at $6626.3.

The CMF had spiked to the upper strata strongly for the first time since the middle of October 2019. The climb meant that investors were regaining their faith in Bitcoin.

The Awesome Oscillator signalled green for the first time in 2020. Together with the CMF, we can speculate that institutional investors were increasing their ramp up towards the Bitcoin industry,

The Parabolic SAR for Bitcoin’s long term price also remained bullish, a positive sign for traders. The markers remained below the price candles and assured holders that the atmosphere was bullish.

Bitcoin’s price prediction has always been tricky with analysis, with multiple factors affecting its movement. The above-mentioned Bitcoin price charts and indicators have all in tandem stated that Bitcoin’s strong start to the year will bring its dividends soon.


Filed Under: Market Analysis Tagged With: Awesome Oscillator, Bitcoin (BTC), Bitcoin [BTC/USD] Price Analysis, Bitcoin 2020, Bitcoin news, bitcoin price, Bitcoin Price Analysis:, btc, BTC/USD, Chaikin Money Flow, Cryptocurrency, Parabolic SAR

Primary Sidebar

Recent Posts

  • Coinbase Surpasses Satoshi Nakamoto As The Biggest Bitcoin Owner: Arkham Intel September 24, 2023
  • Bitcoin Could Reach $130,000 By 2025, Says Analyst September 24, 2023
  • QCAD Launches On Solana, Offering Efficient Digital Dollar Transactions September 24, 2023
  • Coinbase CEO Brian Armstrong Takes a Stand Against AI Regulation September 24, 2023
  • Chainlink Surges Past $7.12 Amidst 2-Month High In Unique Addresses September 23, 2023

Footer

News

  • Altcoin News
  • Bitcoin News
  • Blockchain
  • Tron News
  • World

Digest

  • Meet the Founder
  • Price Winning Article
  • DeFi
  • Cyber Security
  • Crypto Scam

Industry

  • Project Review
  • Technology
  • Fintech
  • Tron Exchange
  • New in Town

Tron Universe

  • Event and Tron Parties
  • New in Town
  • Tron Tokens

Follow Us

Subscribe US

Copyright © 2023 · Tron Weekly. All Rights Reserved. NOTE: Tron Weekly is an independent crypto news site that adheres to the strict journalism policy anchored on transparency, trust, and objectivity, we have no affiliation with the TRON Foundation, its founder Justin Sun or any other cryptocurrency firm.