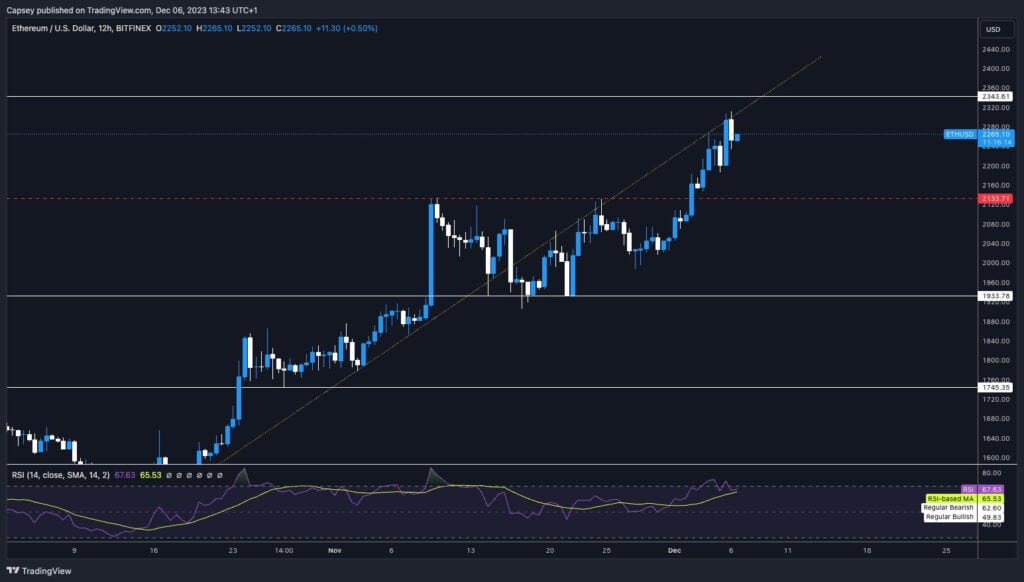
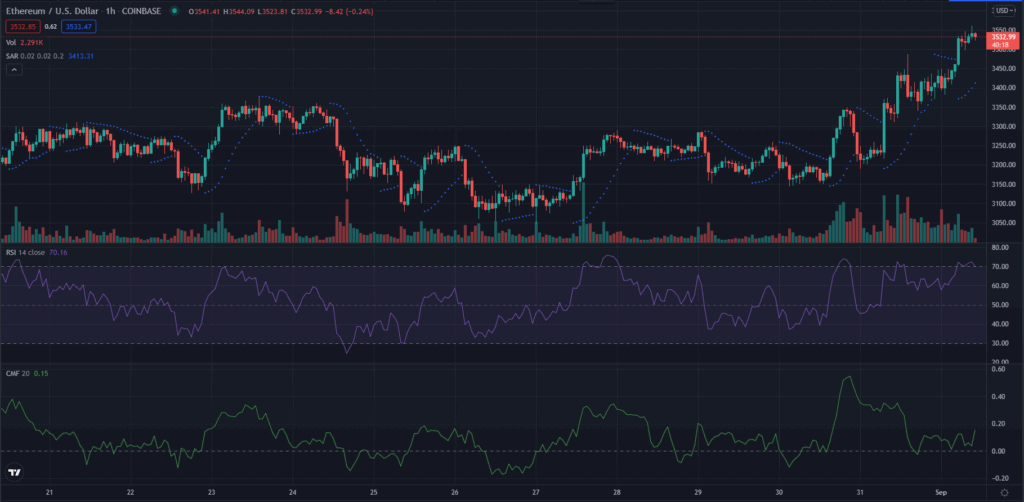
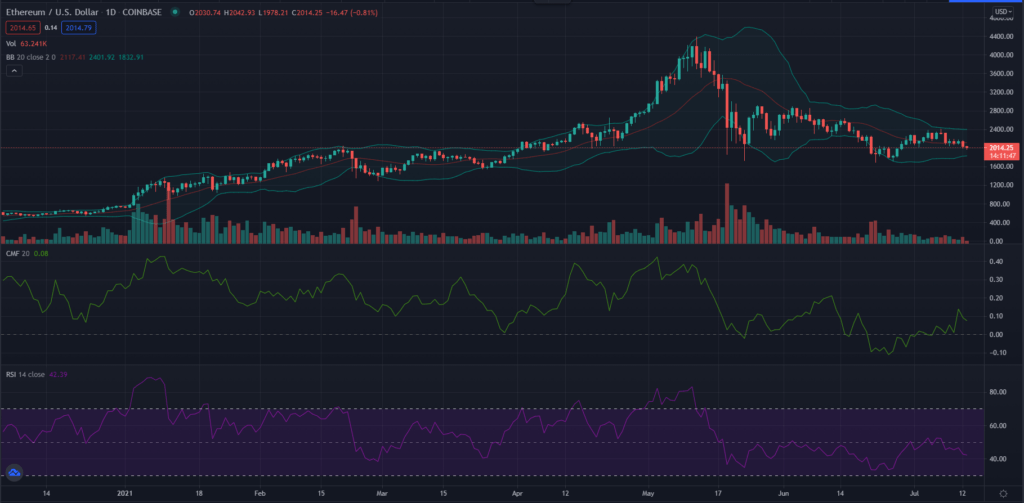
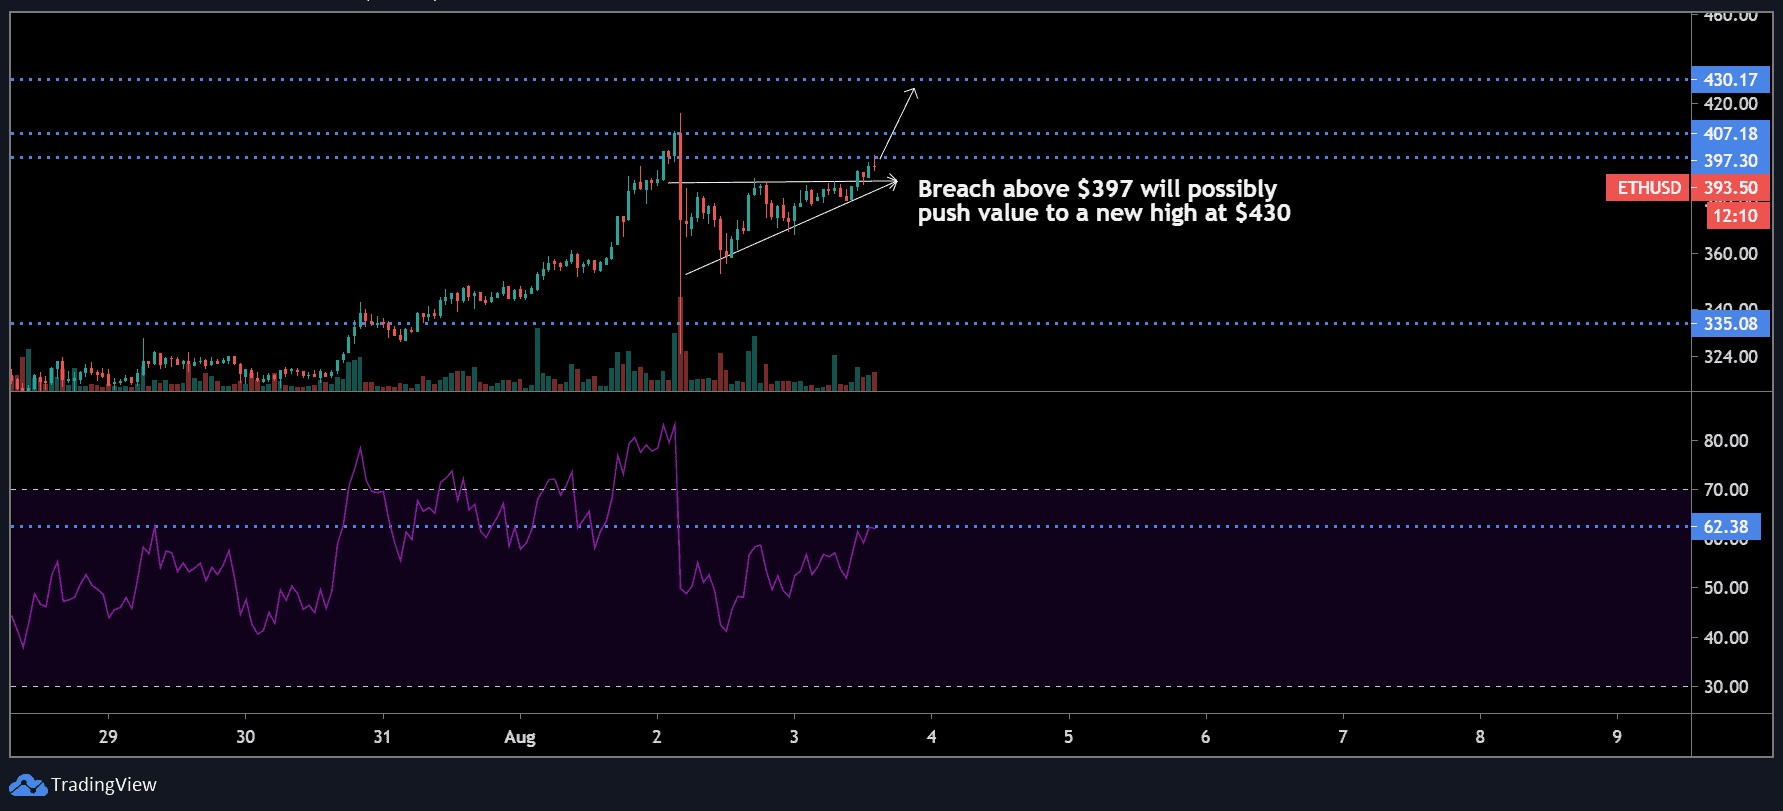
According to the recent analysis from Cryptonary, Ethereum (ETH) has successfully broken out of the pennant pattern, surging towards the critical $2,340 horizontal resistance. This move aligns with the predictions made just a day ago by analysts at Cryptonary.
Technical analysis reveals that ETH not only breached the pennant pattern but has also reclaimed its primary uptrend, marking a bullish turn for its price. Currently, the cryptocurrency is engaged in a battle to maintain levels above the newly flipped $2,340 horizontal resistance, which is now potentially functioning as support. Simultaneously, ETH must uphold the uptrend line.
Should a more substantial breakdown occur, market analysts anticipate the $2,120 area to serve as a robust support level. The Relative Strength Index (RSI) indicates that ETH has entered overbought territory across major timeframes, prompting a cautious approach.
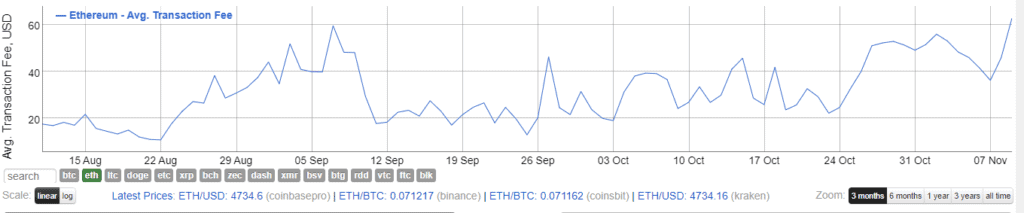
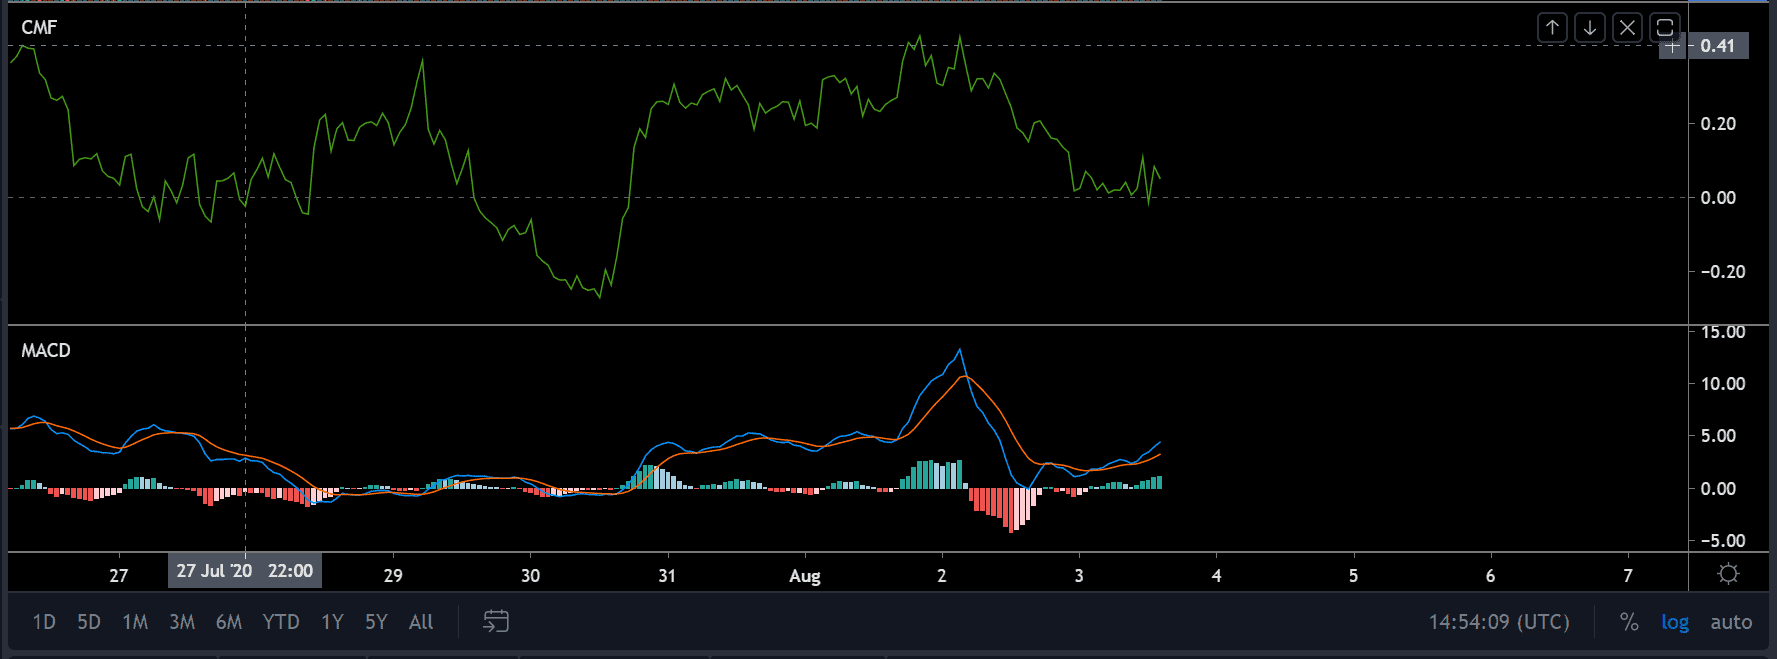
Market mechanics come into play with Ethereum’s Open Interest (OI) surging to new local highs at $8.47 billion. The OI-Weighted Funding Rate has concurrently increased to 0.023%, signaling a market bias towards Long positions. Longs are displaying a willingness to pay a relatively significant premium compared to Shorts, indicating a prevailing positive sentiment.
Ethereum: Cautious Optimism Amid Long Vulnerability
Cryptonary’s perspective on the situation is cautiously optimistic. As anticipated, ETH appears to be entering a new trading range between $2,340 and $2,640. However, short-term stability hinges on ETH maintaining levels above $2,340 to establish this area as a solid support zone.
Despite the positive outlook, analysts at Cryptonary express concern about long positions potentially being vulnerable to a flush. The Funding rate, standing at 0.023%, suggests that Longs are exposed and may face risks in the near term.
Cryptonary maintains its position in ETH and reveals a strategy of Dollar-Cost Averaging (DCA) further into ETH in the event of a retracement to $2,120. This approach reflects a commitment to navigate market volatility and capitalize on potential buying opportunities. However, investors and traders are advised to monitor these critical levels closely and remain vigilant to changes in market sentiment that could impact the trajectory of Ethereum in the coming days.
Related Reading | Bitcoin Ordinals Record-Breaking Sale Hits 10.4 BTC