According to the Glassnode report, the recent surge in interest surrounding new spot Bitcoin ETFs, the landscape of digital assets is experiencing a notable uptick, potentially signaling the onset of a bullish market trend. Investors are closely monitoring capital rotation into alternative cryptocurrencies (altcoins), a topic previously explored in WoC 04 to discern prevailing market sentiments and risk appetites.
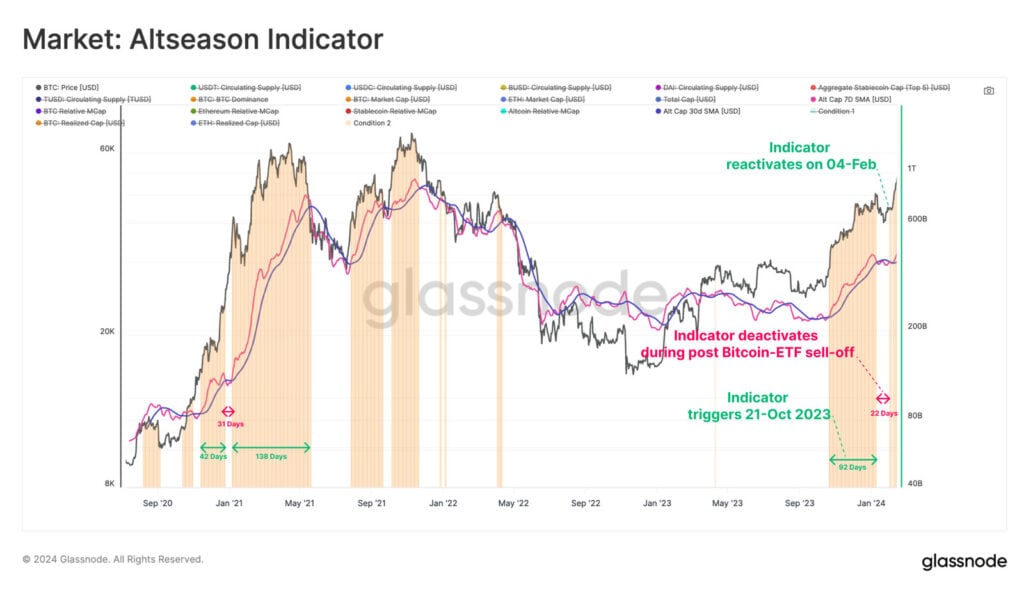
Key insights from Glassnode Altcoin Indicator, a macro-level gauge tracking momentum within the Total Altcoin Cap and the inflow of capital into major cryptocurrencies like Bitcoin (BTC), Ethereum (ETH), and Stablecoins, suggest a positive momentum trajectory since October of the previous year. Despite a temporary pause following the launch of Bitcoin ETFs, this momentum reignited on February 4th.
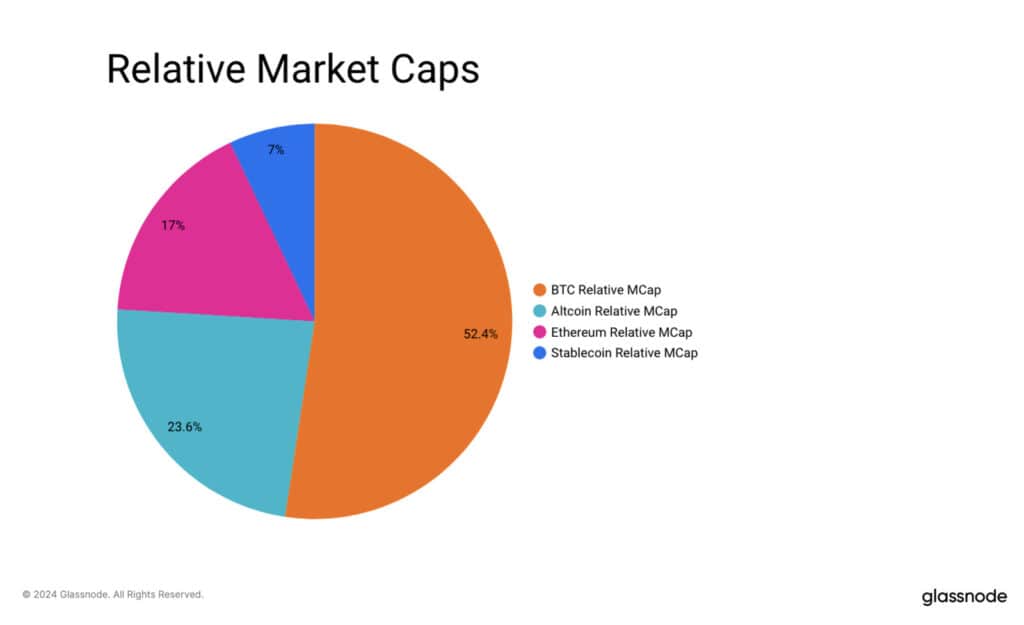
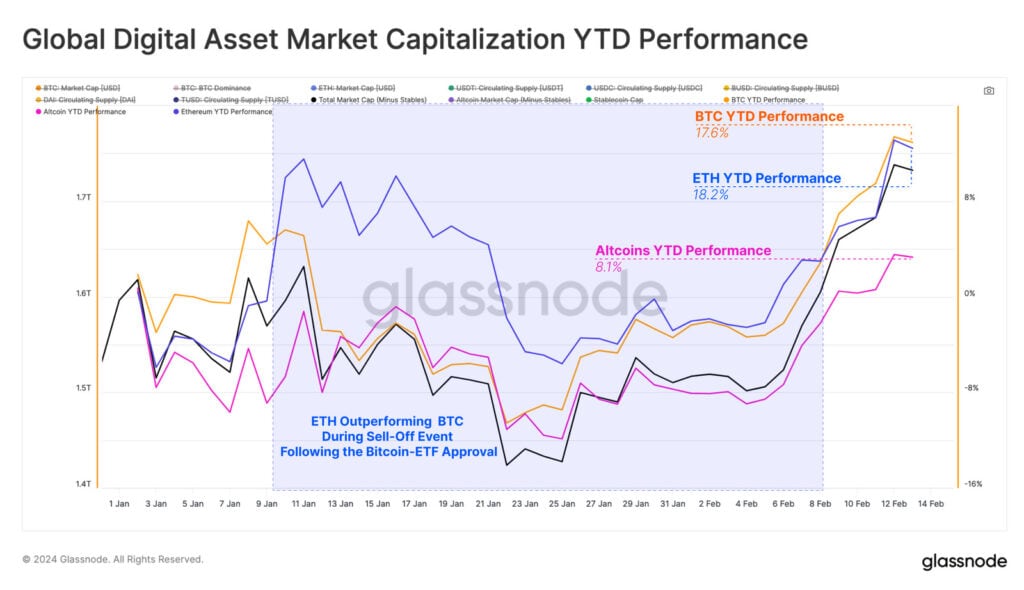
Bitcoin remained in the lead when it came to market capitalization, accounting for more than 52% of the total digital asset market cap. Ethereum came second at 17%, with stablecoins at 7%, leaving another 24% to be spread evenly throughout the rest of the altcoin sector.
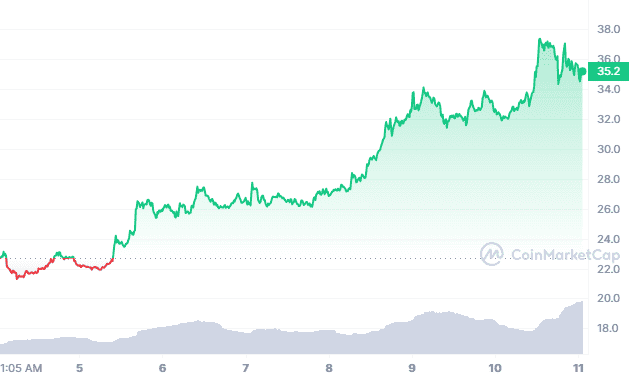
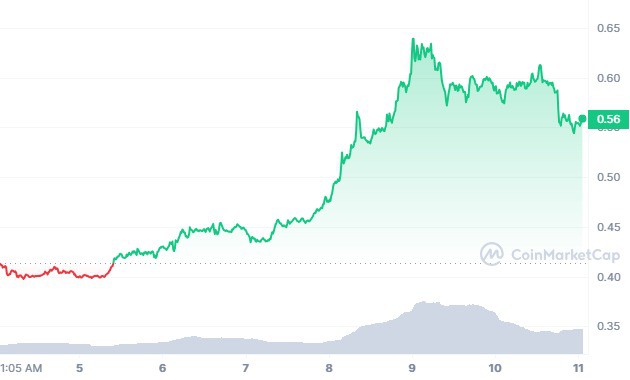
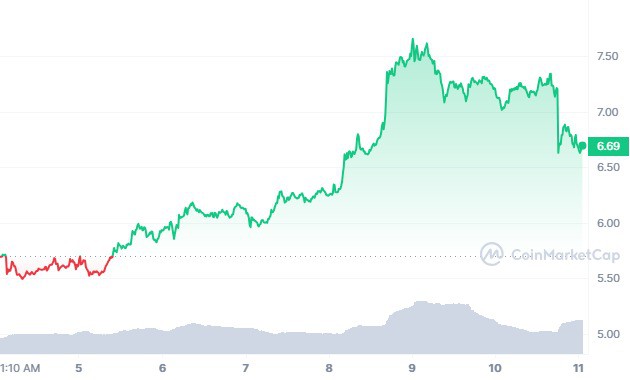
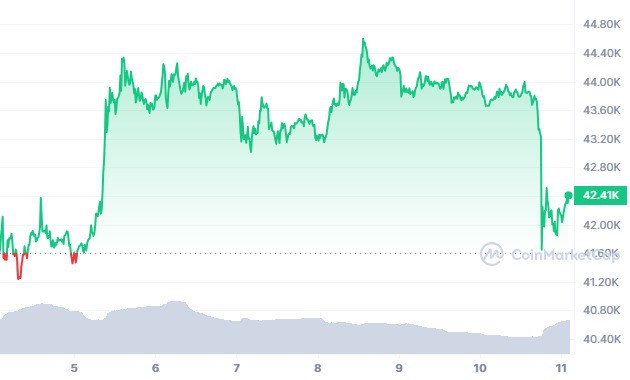
Also painting some of the year-to-date gains, it became clear that Bitcoin and Ethereum remain at the head of the pack and in the front runners, having both gained +17.6% and +18.2%, respectively, outpacing the performance of the broader basket of altcoins.
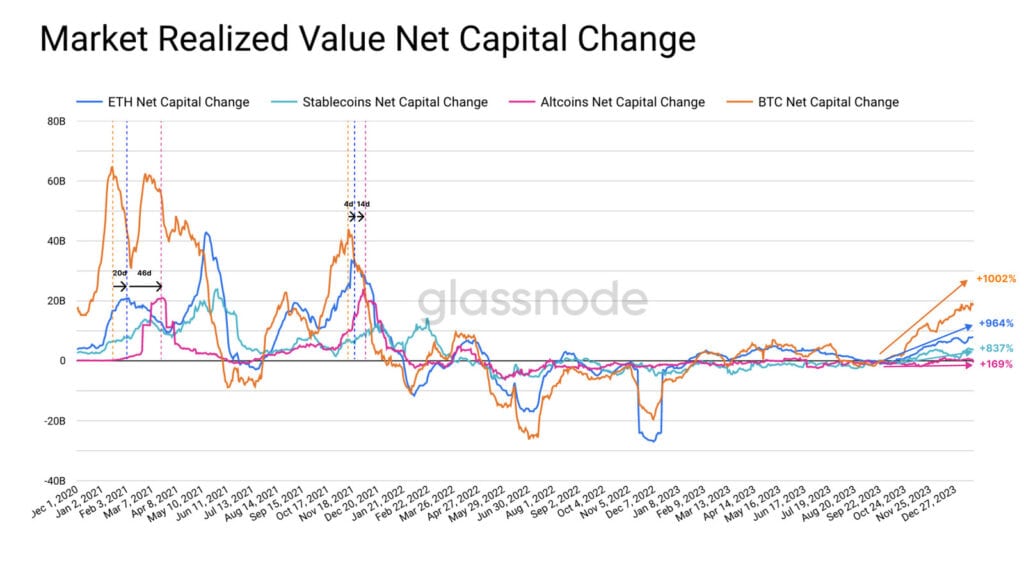
Continuing with the sector’s Realized Cap, further analysis of capital movements inside the digital asset markets, already observed, only confirms that the appeal of Bitcoin is dominating while Ethereum is slowly catching up. The above observation also indicates further that after the gain of strength in Ethereum, altcoins see capital inflow, hence the slow rotation down the risk curve relative to the majors.
Key trends in Altcoin trading behavior
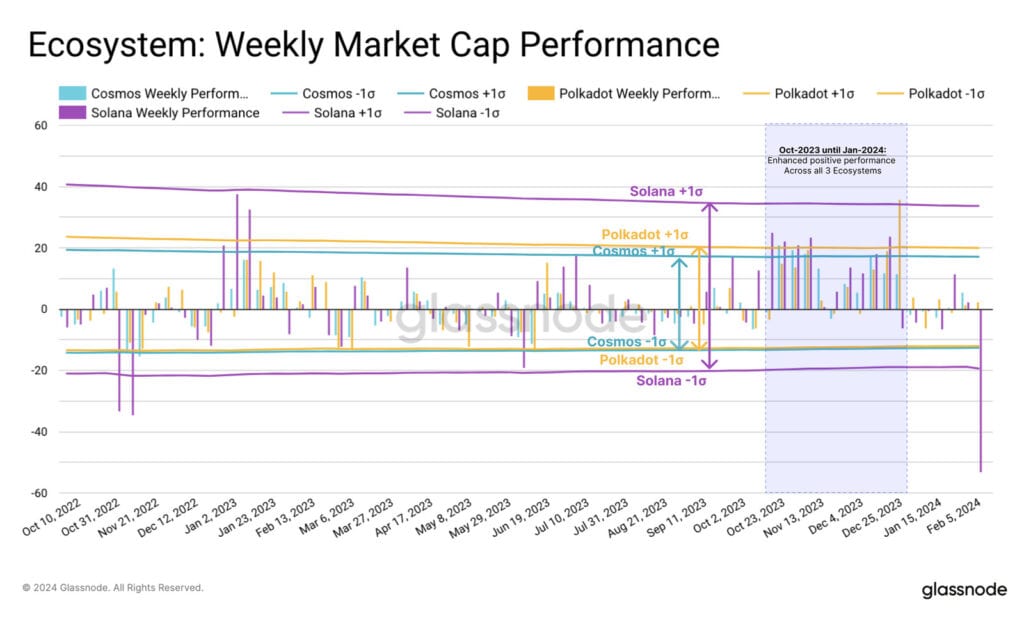
Across diverse ecosystems, including Ethereum, Cosmos, Polkadot, and Solana, analysis demonstrates that the standout performance of Solana is characterized by high volatility as well as significant upside gains. But the capital inflows have been seen in the Ethereum ecosystem with changing magnitudes, whereby sectors like DeFi, GameFi, Staking, and Staking tokens have started depicting some positive consistency.
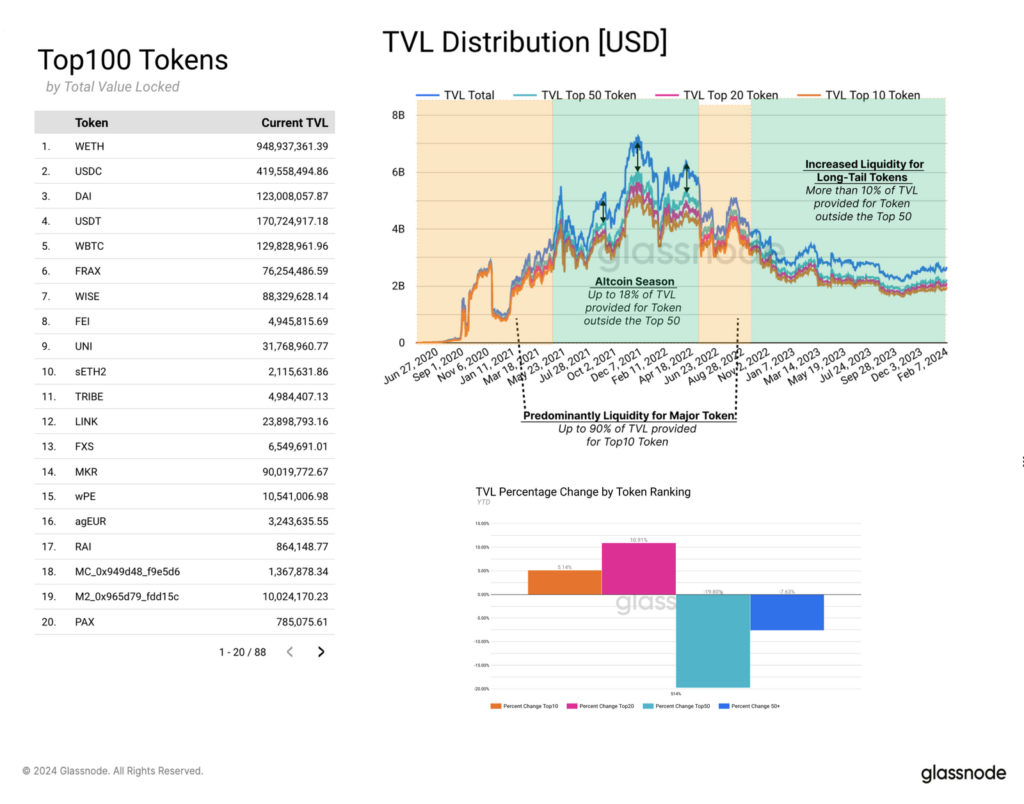
Uniswap, being a decentralized exchange and an indicator of altcoin trading tendencies, has shown a steady growth in altcoin trading demand, accounting for nearly 12% of Uniswap volume. This implies that investors are increasingly becoming interested in longer-tail assets.
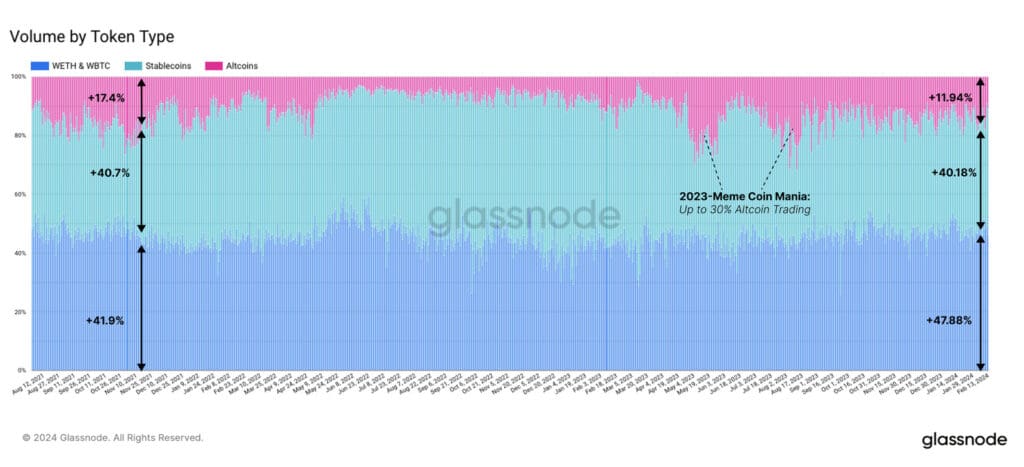
Changes in liquidity provisioning on Uniswap mirror shifting market dynamics, with evident increased liquidity observed for tokens beyond the top 50, indicative of cautiously expanding interest in less mainstream assets. But, though liquidity has moved along the risk curve, the same can’t be said for trade volume, and this has now been confirmed, so the cautious hypothesis of investor behavior is more firm.
Nevertheless, the rise caused by the advent of Bitcoin ETFs is seen as positive for digital assets. However, most capital moving into altcoins is still focused on higher market cap assets, which indicates investors’ selectivity. Such emerging ecosystems as Solana, Polkadot, and Cosmos are remolding Ethereum’s traditional dominance and transforming market dynamics as the digital asset landscape continues evolving.