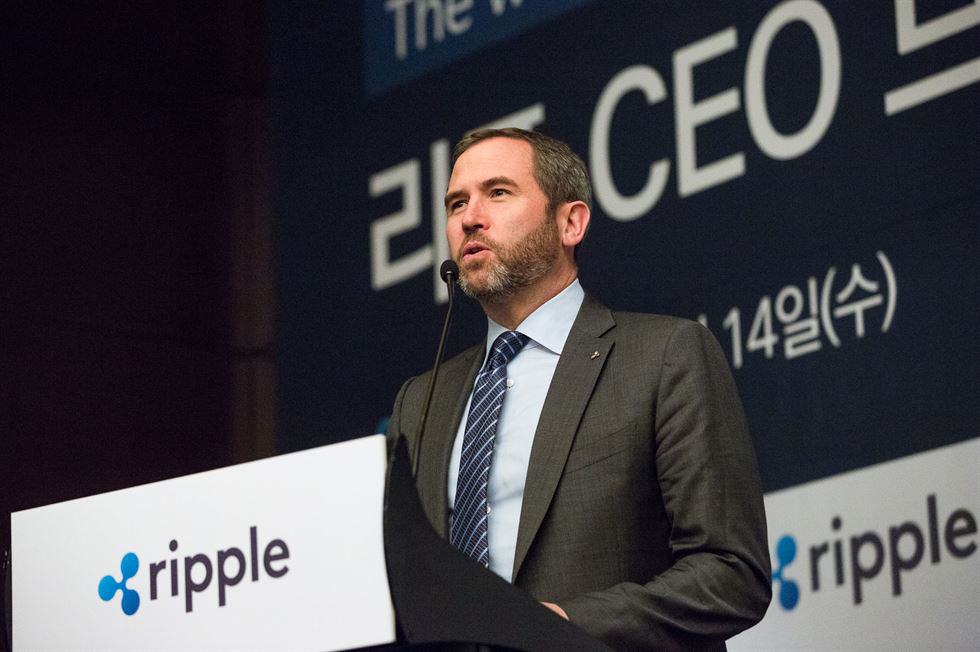
Zach Rector, a prominent member of the Ripple community, identified three significant events that may potentially increase the price of XRP. Given the Ripple community’s eagerness to see a price surge, Rector’s observations have sparked a debate within the community.
Rector’s first argument centers around the ongoing lawsuit between Ripple and the US Securities and Exchange Commission (SEC). He posits that the US court’s refusal to grant the SEC permission to appeal the Ripple non-security status judgment could significantly impact XRP’s price. Typically, parties in a lawsuit can only contest court rulings once the case concludes. The SEC’s attempt to challenge this norm has sparked anticipation within the Ripple community. Ripple has also indicated its intention to file counter-appeals should the SEC’s bid be approved. For Ripple enthusiasts, denying the SEC’s request would mark a turning point for the digital asset.
XRP’s Potential Game-Changer
Rector’s second point revolves around adopting Ripple’s On-Demand Liquidity (ODL) product by a prominent US-based financial institution. Given the recent regulatory clarity surrounding Ripple, many within the community are hopeful that US banks will start integrating Ripple into their operations. This adoption could be a game-changer for Ripple’s value. It’s worth noting that Ripple’s previous XRP offerings to US institutions were seen as a significant stumbling block in the ongoing legal battle.
Lastly, Rector suggests that a settlement in Ripple’s legal battle with the SEC could ultimately catalyze XRP’s price surge. A settlement would signal the end of a protracted legal dispute over multiple years. Such a resolution would undoubtedly profoundly impact the Ripple market sentiment.
However, not everyone in the XRP community shares Rector’s optimism. One Ripple enthusiast, Chad, dismissed these events as mere ‘pump and dump’ opportunities. He argues that the utility of Ripple should be the primary driver of its price, not speculative events. Another user, Daren Black, concurred, emphasizing that true value would only materialize with increased utility and retail adoption, possibly after Bitcoin undergoes its halving.
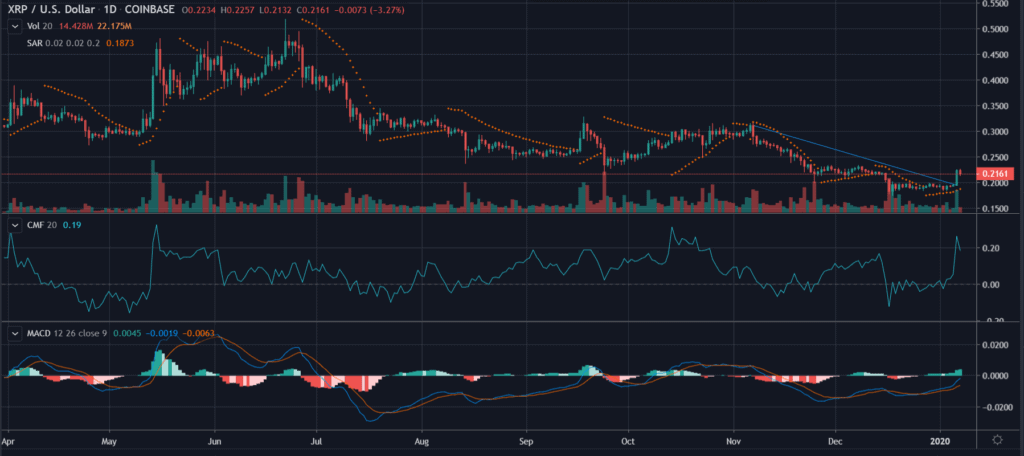
As of the latest data, XRP is trading at 0.4708 and has experienced a 5.81% decline in the past 24 hours and a 6.12% drop over the past week. With XRP trading below the $0.5 mark, the community remains on edge, hoping that one of the mentioned events, or a combination of them, will reignite a rally akin to the surge witnessed after the victory ruling in XRP’s favor.
Related Reading: | Ripple Fights Back Against SEC Appeal Over XRP Security Status

![XRP [XRP/USD] Price Analysis: Cryptocurrency Price Sees Reprieve in Short Term as it Struggles to Break $0.2](https://www.tronweekly.com/wp-content/uploads/2020/01/xrp-1-hour-1-1024x456.png)
![XRP [XRP/USD] Price Analysis: Cryptocurrency Price Sees Reprieve in Short Term as it Struggles to Break $0.2](https://www.tronweekly.com/wp-content/uploads/2020/01/xrp-1-day-1-1024x456.png)