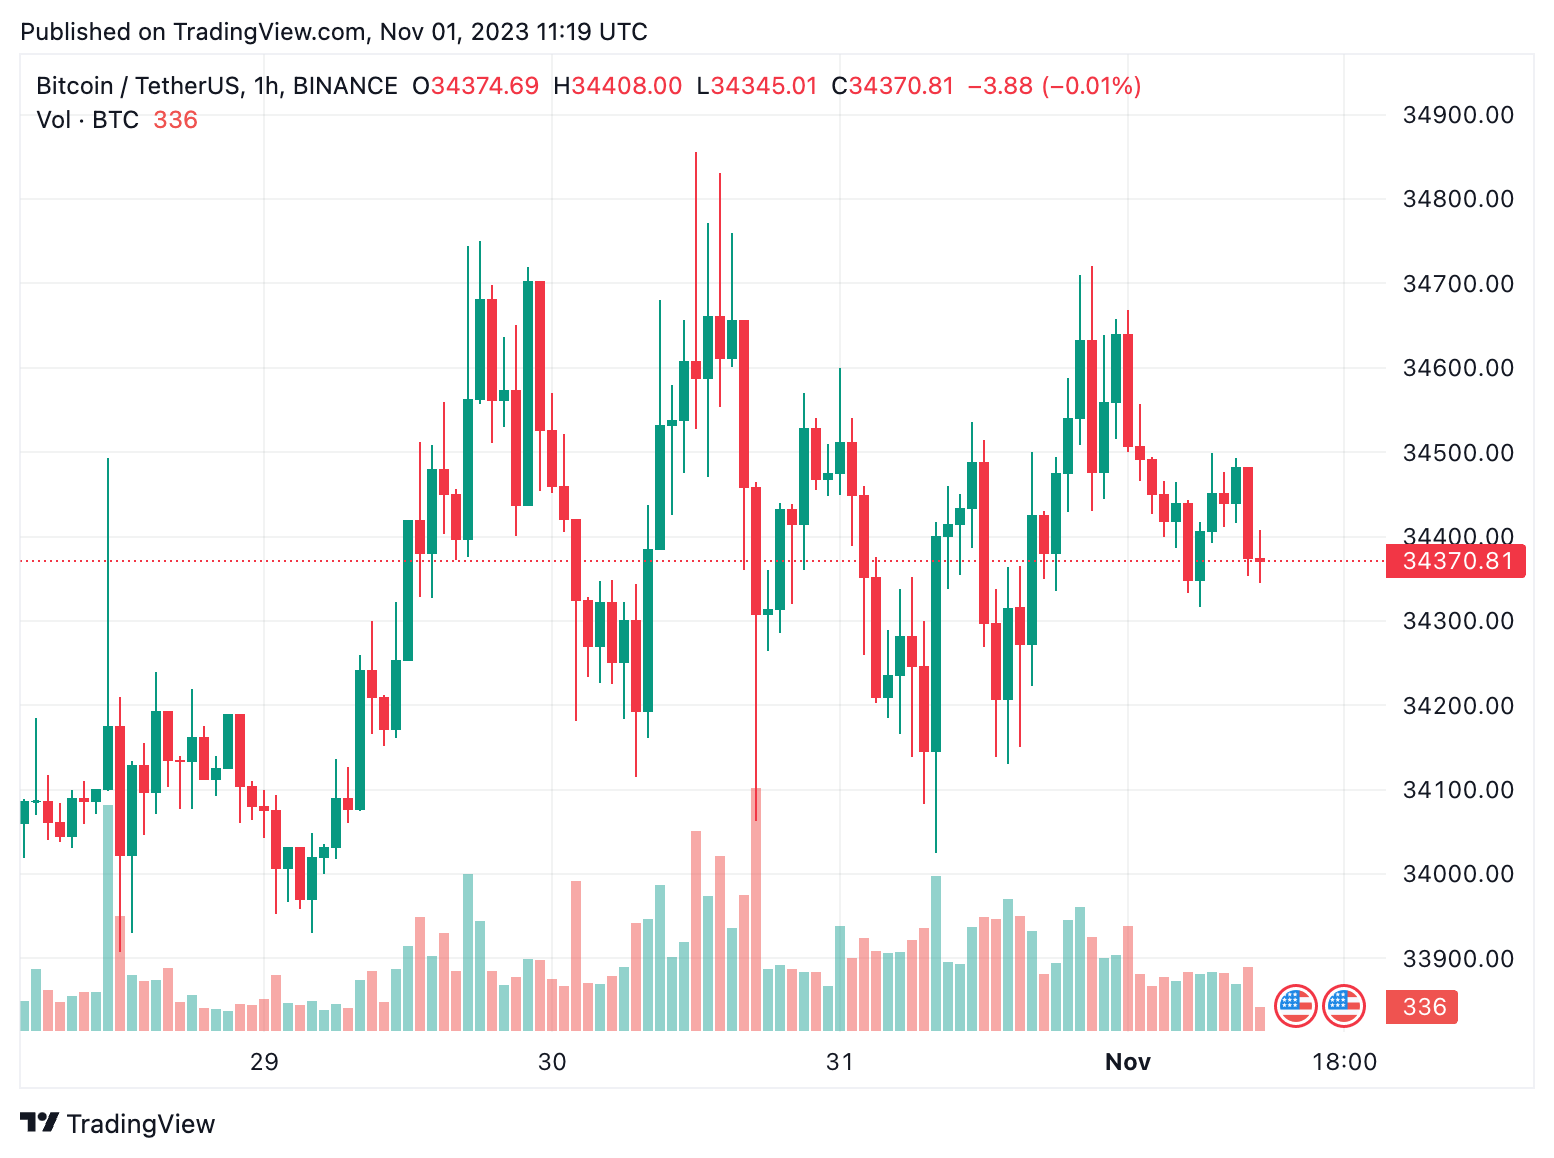
The cryptocurrency market has displayed remarkable resilience as Bitcoin (BTC) recently experienced an initial rejection from a critical zone, identified as the “bull/bear line in the sand” at $33,900. However, this rejection lacked follow-through, resulting in a higher low for now.
The noted $33.9k level held, leading to speculation that a successful reclaim of this critical level would be regarded as a bullish signal. Market watchers are keen to observe how events unfold in the coming days.
The anticipation for market developments remains high, with crypto trader Mind Trader pointing out a Fibonacci 1.618 extension target within the range of $36,000 to $36,170.
Will Bitcoin Break Out or Consolidate in Its Ascension?
The big question is whether the price will make a direct breakout at this level or undergo some pullback and consolidation before continuing its upward trajectory. As with many aspects of cryptocurrency trading, time holds the answer.
Technical analysts are also at work, dissecting the market’s movements. Some experts suggest that the ongoing pattern appears to evolve into a Wave (e) that may manifest as a Triangle.
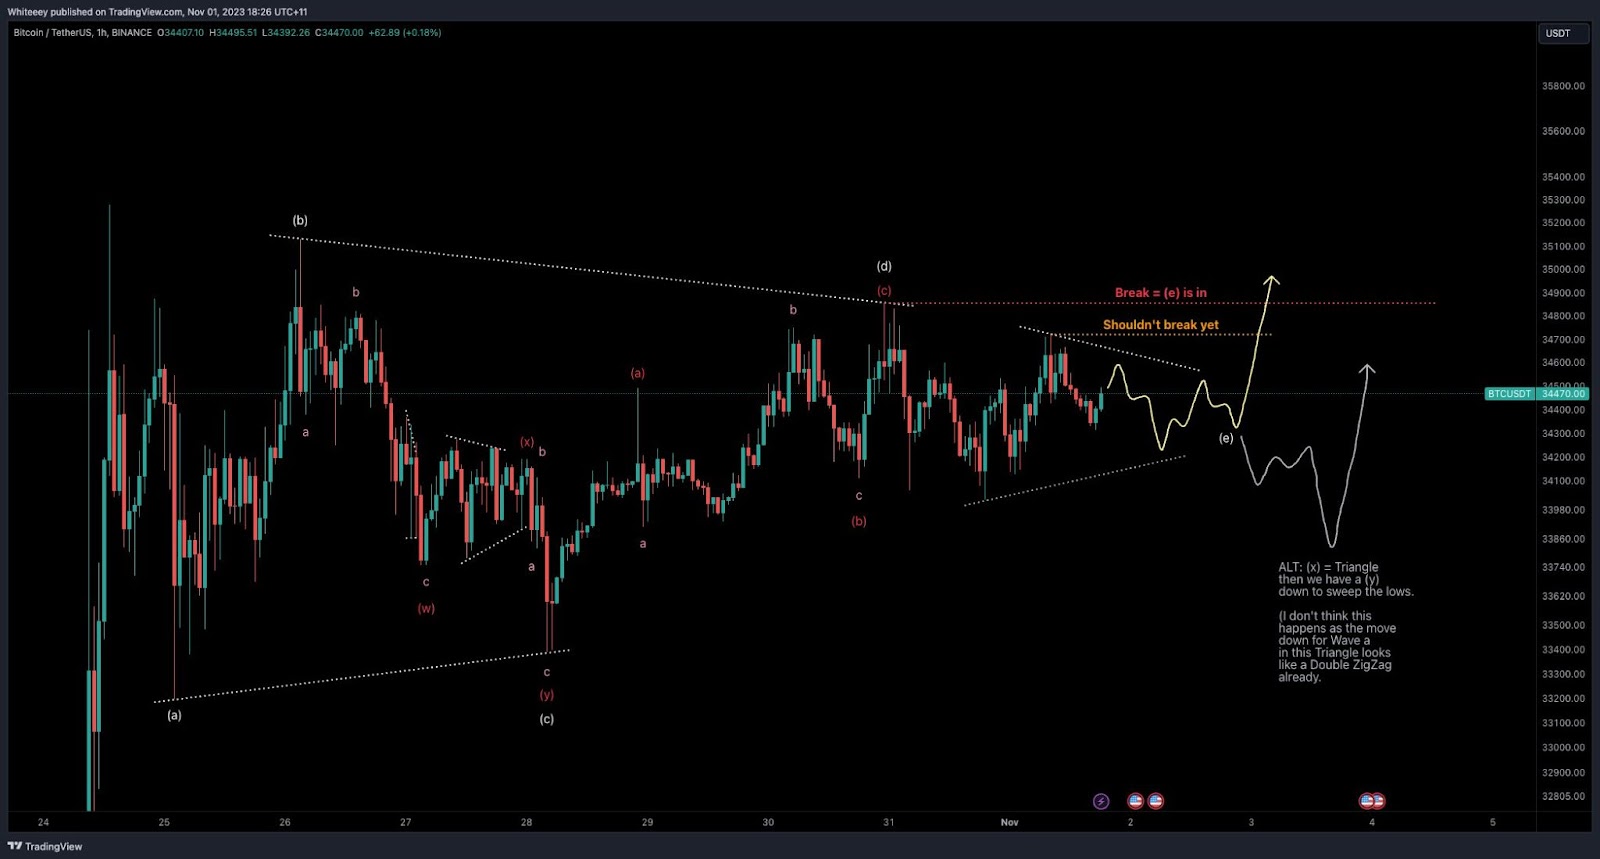
This analysis is supported by the fact that the first trade, initiated some days ago, remains active. Although the second trade encountered a stop-out, traders remain confident and maintain long positions, with plans to add to their positions upon the confirmation of Wave (e) with a break of previous highs.
The cryptocurrency market continues to captivate investors and traders with its dynamic and sometimes unpredictable movements. As Bitcoin strives to maintain its position, the community of crypto enthusiasts eagerly awaits further developments.
According to CoinmarketCap, Bitcoin (BTC) is trading at $34,406.59, accompanied by a 24-hour trading volume of $10,769,032,895.04. Over the last day, it has experienced a 0.17% decline in price, while over the past week, there has been a modest 0.48% price increase.