Ripple (XRP) witnessed a significant downturn in line with the broader cryptocurrency market, particularly Bitcoin, retracing to a pivotal support level at $0.41. Following this retracement, XRP demonstrated resilience by rebounding decisively from this critical level. Despite the initial decline, XRP is signalling a potential upward trajectory.
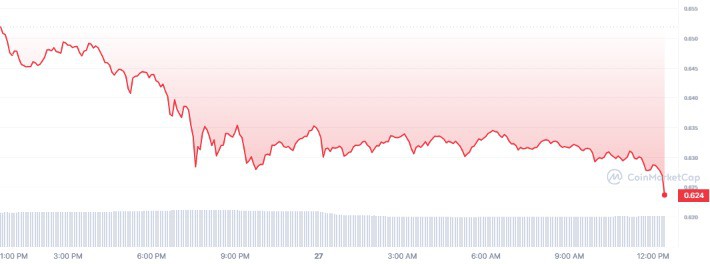
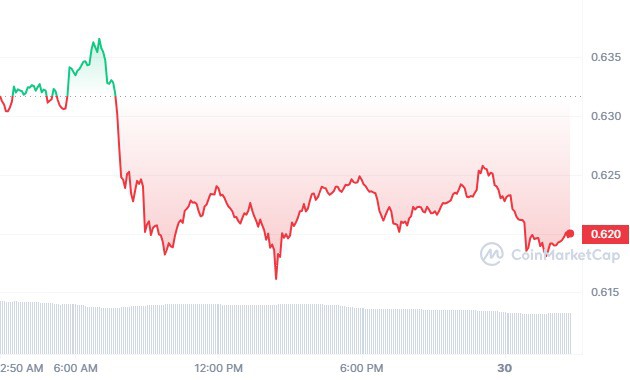
At the time of writing, the current price of XRP is $0.514868. It has a notable 24-hour trading volume of $18.61 billion and a market capitalization of $28.38 billion. Over the past day, XRP has experienced a commendable surge of 5.26%.
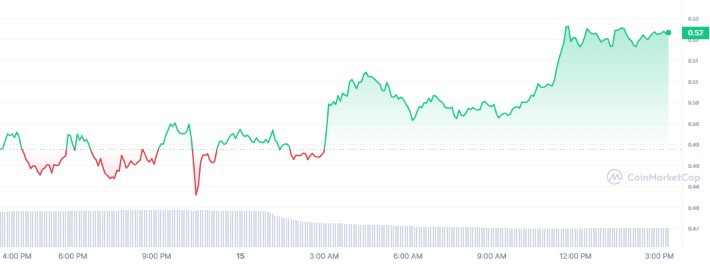
Source: CoinMarketcap
Analyst Forecasts XRP Surge to $1.2 – $1.5 Range
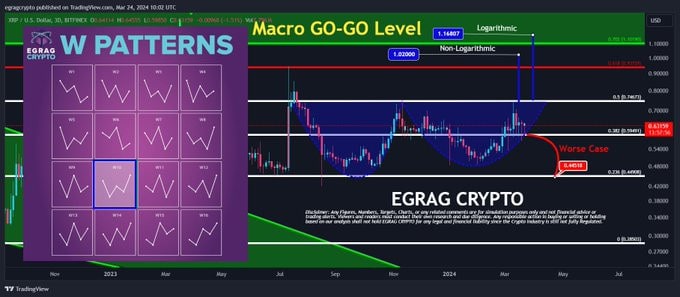
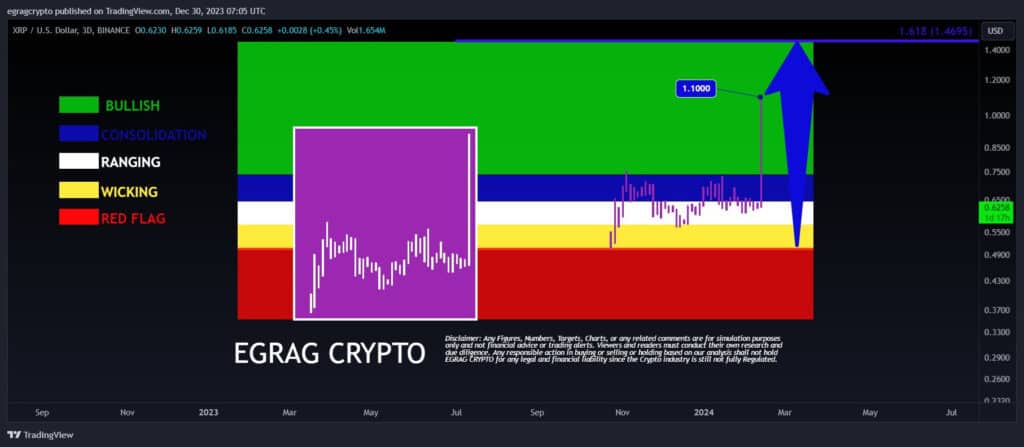
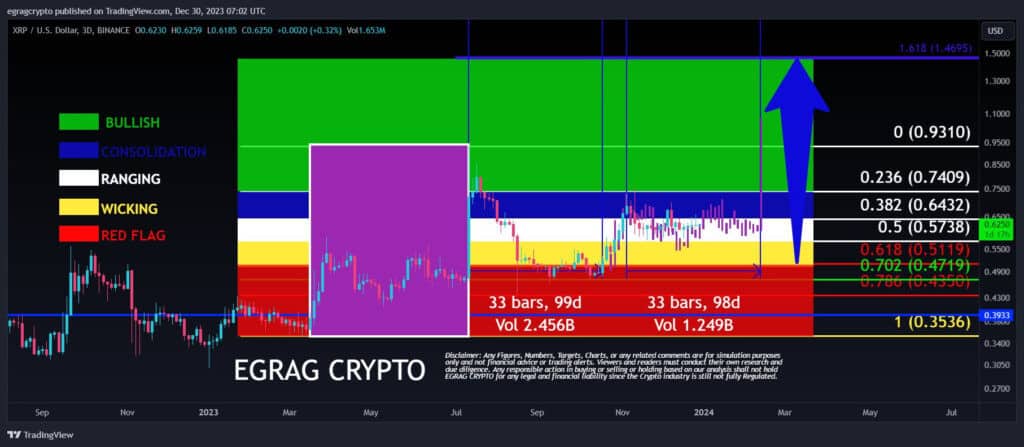
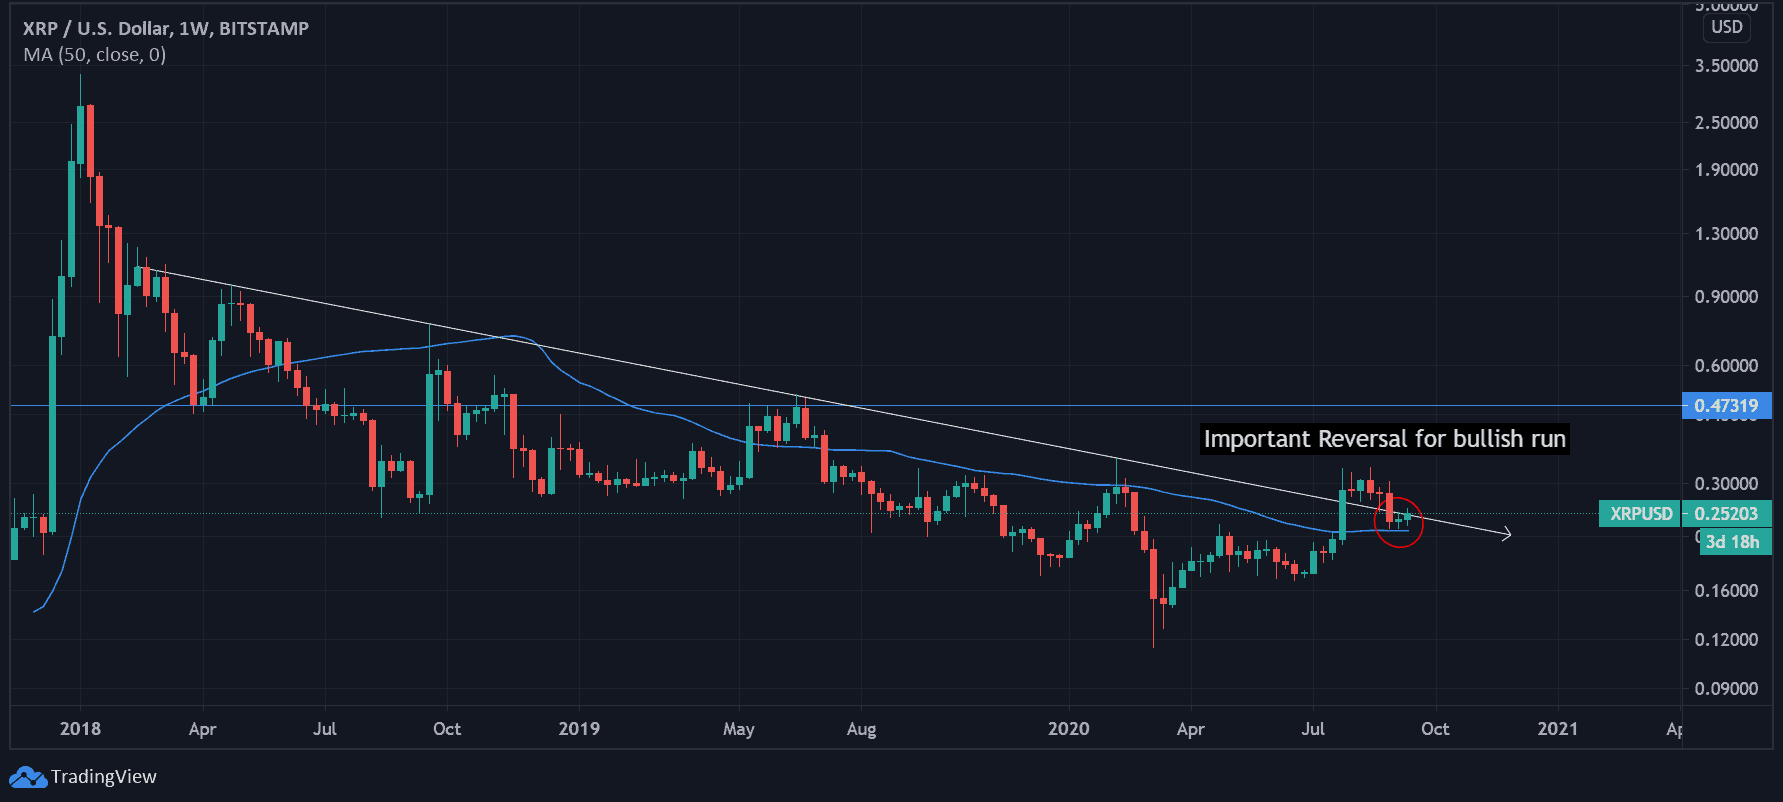
Renowned crypto analyst EGRAG CRYPTO recently shared an insightful bullish forecast regarding the price trajectory of XRP, with a particular focus on the pivotal $0.41 level, symbolized by the striking Red Line. Drawing from past analyses, the analyst emphasized the critical significance of the $0.41 threshold, which has consistently demonstrated its importance within the XRP market dynamics.
Despite a recent downturn prompting concerns and interpretations of bearish sentiment, EGRAG CRYPTO presents a contrasting viewpoint, suggesting that this downturn may actually represent a necessary “flush out” phase, potentially serving as a precursor to bullish developments within the XRP ecosystem.
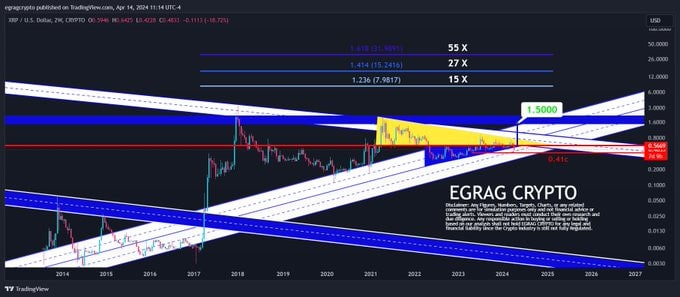
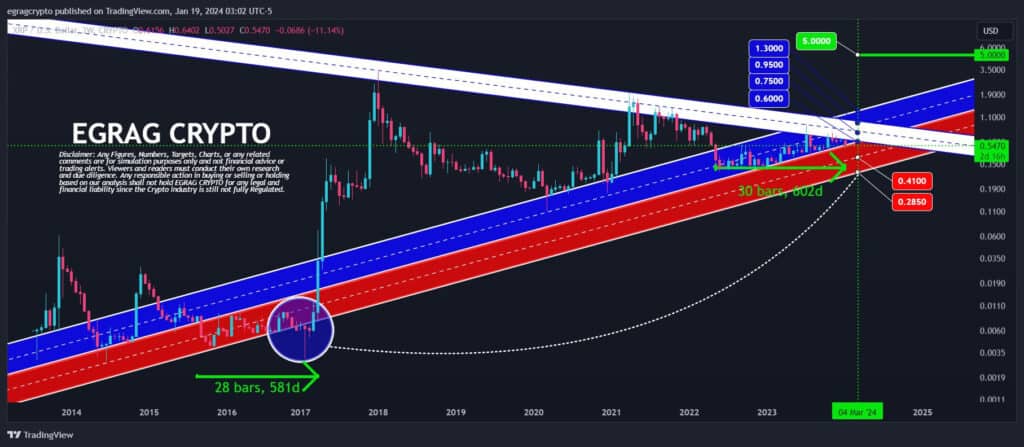
Looking forward with optimism, the analyst foresees a significant upward trajectory for the token, projecting a substantial move towards the price range of $1.2 to $1.5. Following this anticipated surge, there is an expectation for a confirmation of a breakout above the formidable $2 barrier.
These forthcoming movements are anticipated to carry considerable potential gains for investors, with projections indicating the possibility of achieving a remarkable 15X, 27X, or even an astounding 55X increase in XRP value.
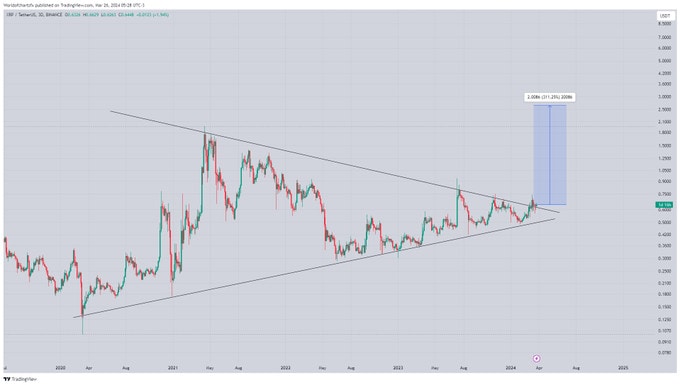
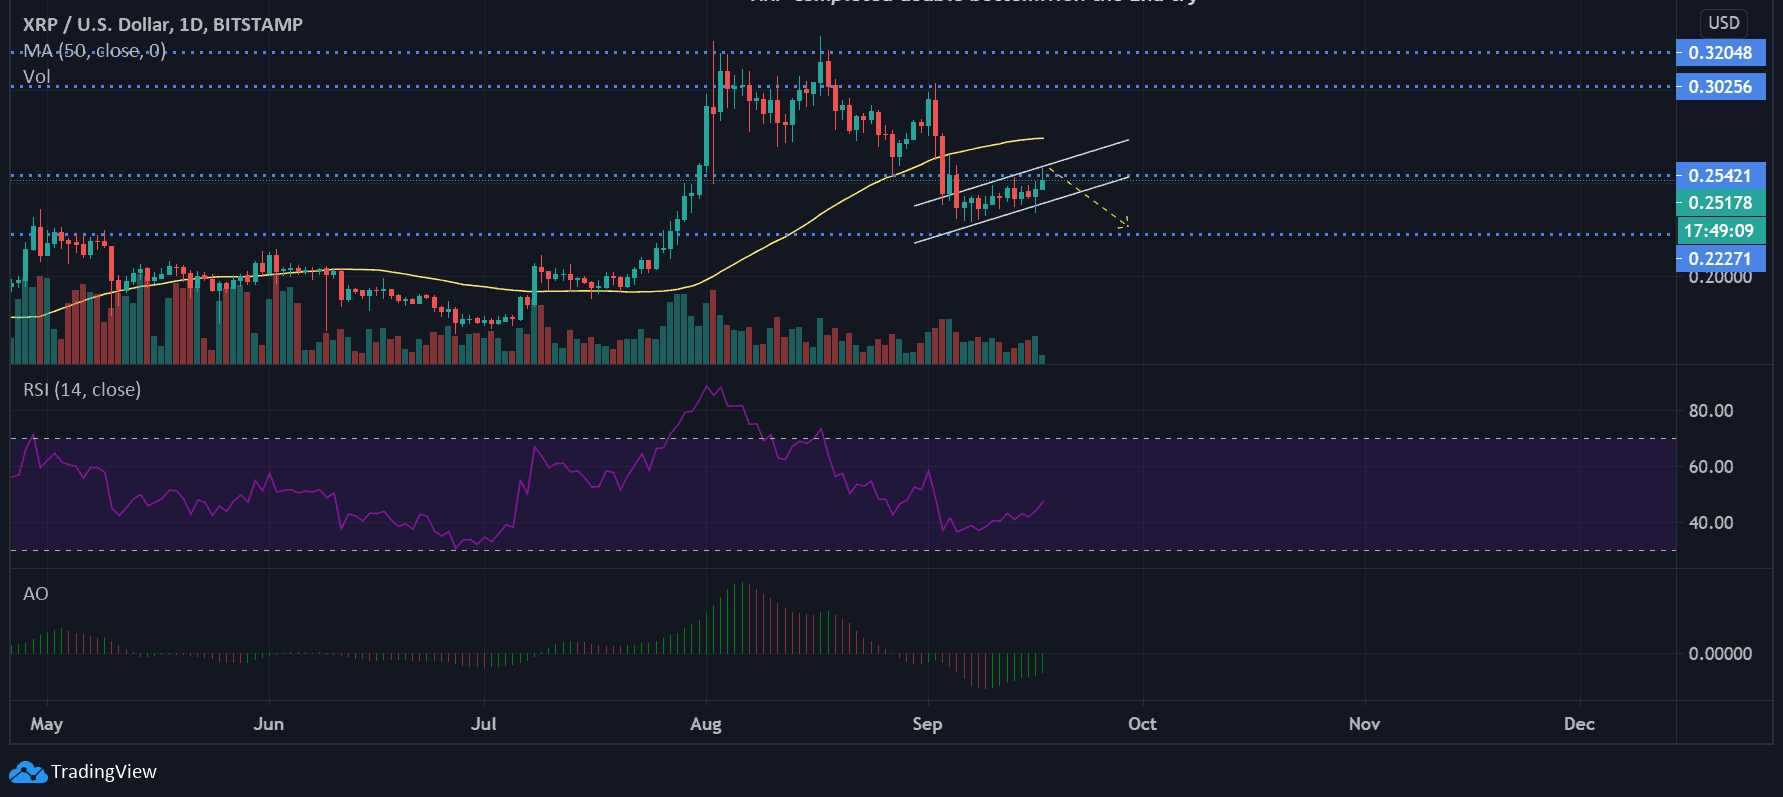
Milkybull Crypto, another respected figure in the crypto analysis realm, recently pointed out a striking observation regarding XRP. Comparing the current market situation to a pivotal moment in 2017, Milkybull Crypto suggests that the current price action for the token resembles a crucial trough point.
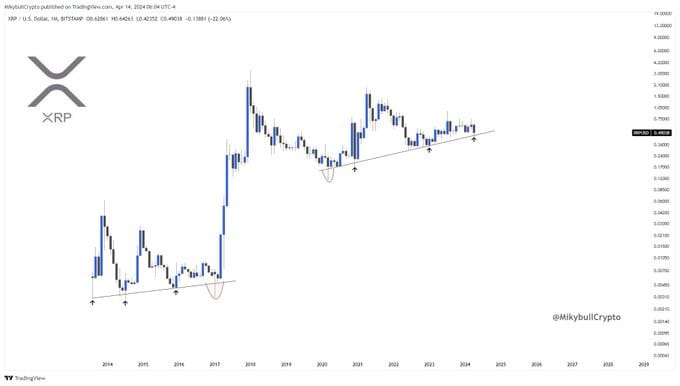
Drawing parallels with historical trends, especially considering the huge jump in prices in 2017, this analyst hints that this downward trend might represent one last opportunity before an explosive upward move.
Related Reading | Cryptocurrency Fluctuates Amidst Iran-Israel Conflict: Report