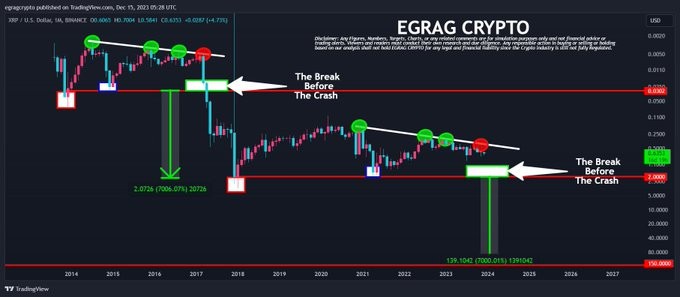
Crypto analyst Egrag Crypto shared a comprehensive analysis of the XRP market, introducing the concept of the White Flame Range and delving into the intricacies of Structural Formation, Sentiment Status, Macro Range, and Psychological Zone.
According to the October 27th, 2023 X post, a clear perspective on the current state of the XRP market, which has been on a retracement journey for the past 191 days since a notable pump in July. Despite the extended period of market turbulence, the MACRO outlook remains steadfast, presenting both challenges and potential opportunities for investors.
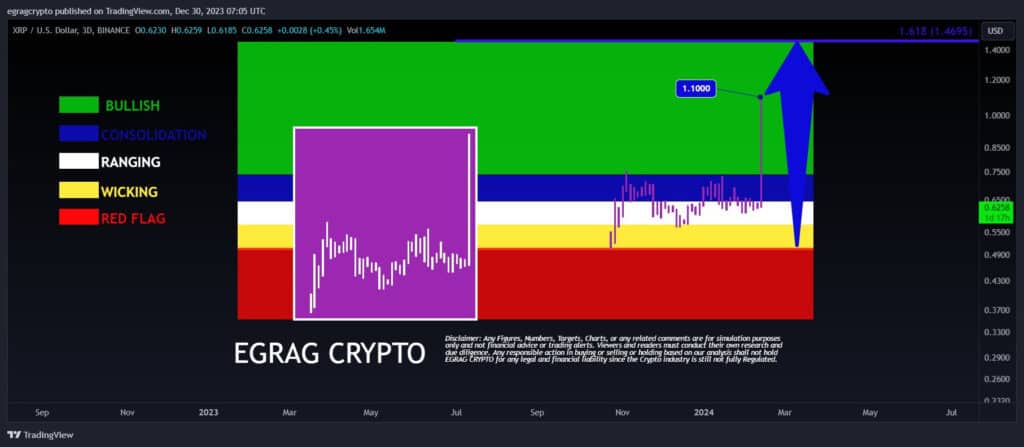
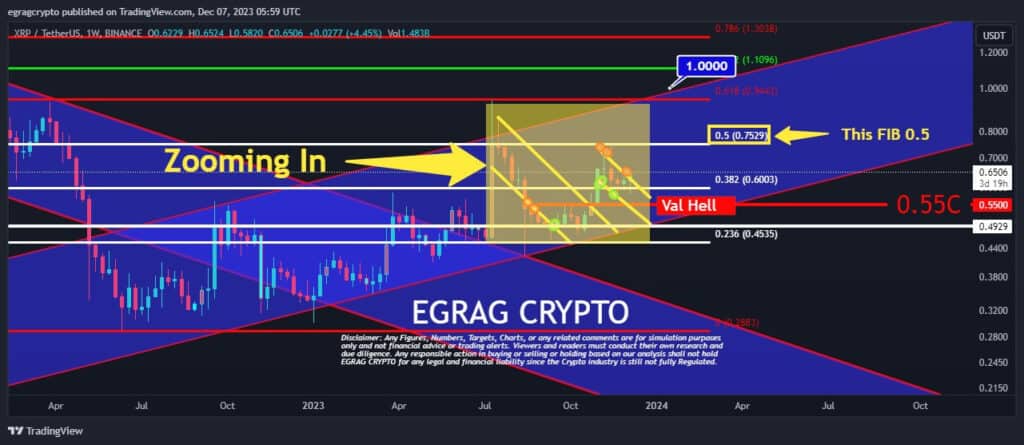
Within the tumultuous sea of market fluctuations, Egrag Crypto introduces the White Flame Range, characterized as an inferno that may either scorch traders or present a rare buying opportunity. The key to success in this volatile environment lies in strategically placing limited buy orders, emphasizing the importance of careful and calculated moves in the current market climate.
Addressing the XRP community, Egrag Crypto encourages holders to stay steady and maintain faith in the face of the ongoing trial of patience. The White Flame may flicker, but the potential payoff is promised to those who endure the storm. The analyst assures that the challenges faced are a testament to future rewards, urging investors to let the journey unfold.
XRP Structural, Sentiment, & Psychology Analysis
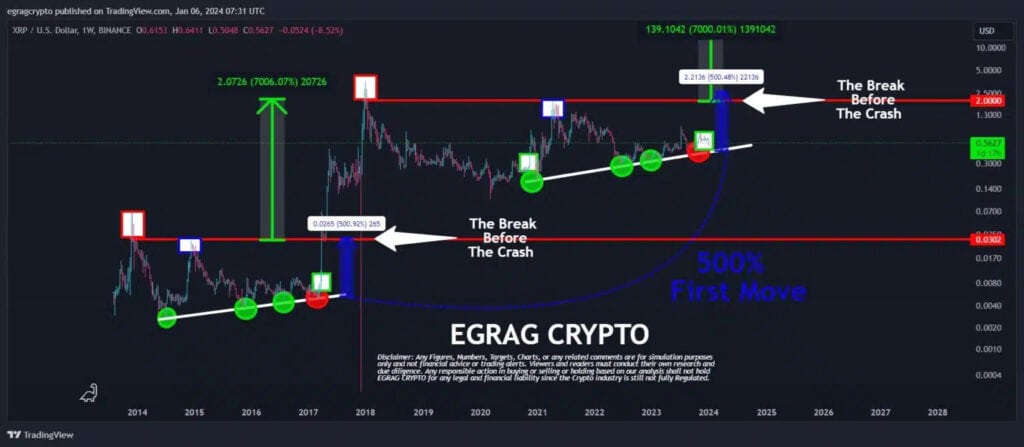
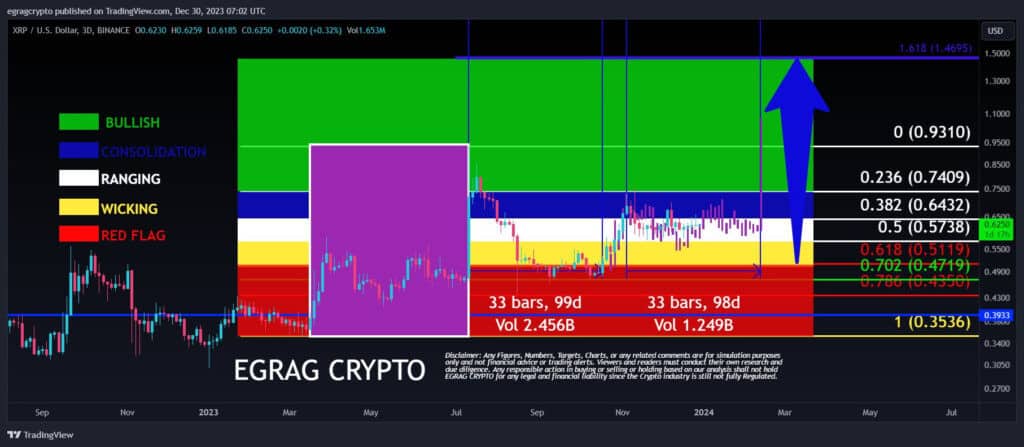
The detailed analysis categorizes XRP based on specific price ranges. The range of 0.54c to 0.58c is identified as the make-or-break range for XRP, playing a pivotal role in market dynamics since May 2022. Recent weeks have seen a robust foundation being laid, hinting at the potential for the next bullish run.
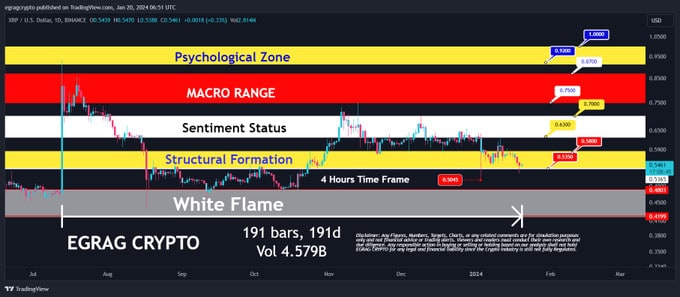
Additionally, the zone of 0.63c-0.70c marks a critical juncture where market sentiment begins to shift. Traders and investors are advised to closely monitor this range, as shifts in sentiment can serve as contrarian indicators for seizing price opportunities and managing risk.
Moreover, the $0.93 to $1 range is described as a psychological battlefield, where emotions such as fear, greed, anxiety, and overconfidence come into play. Traders are cautioned to exercise discipline, stick to their plans, and resist the influence of cognitive biases to navigate this challenging terrain successfully.
XRP’s Potential Double Tap & $5.85 Horizon
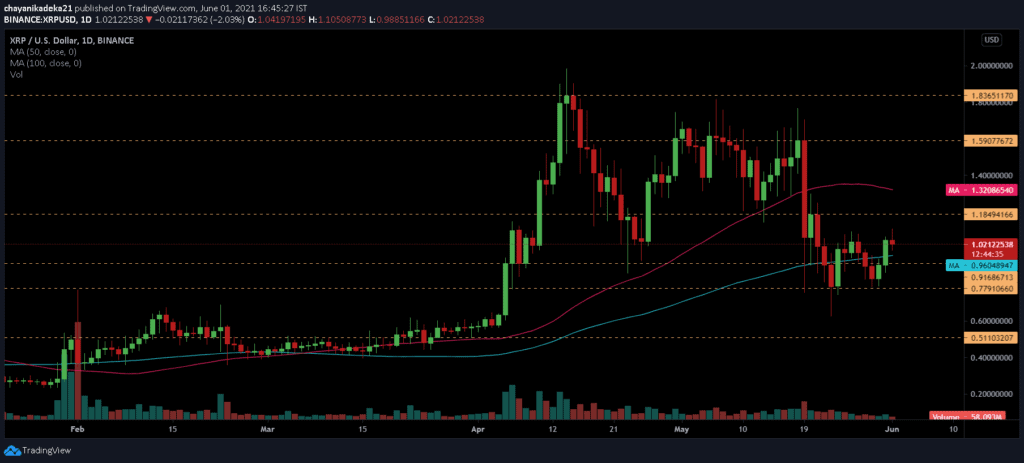
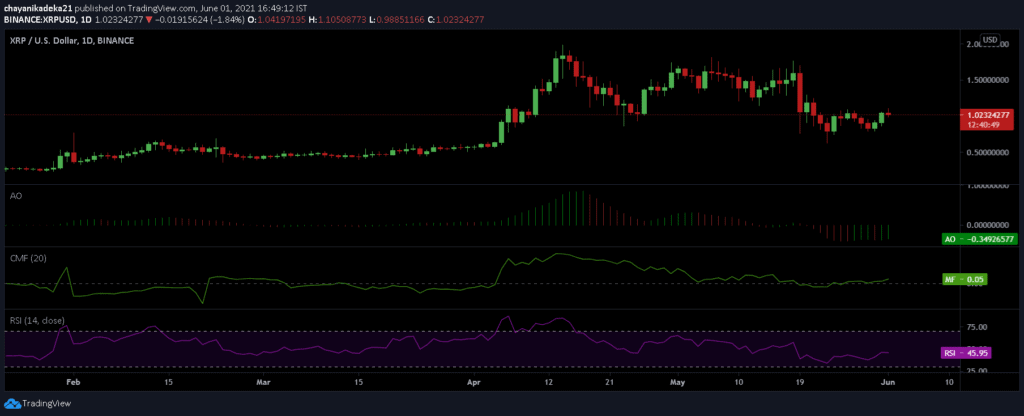
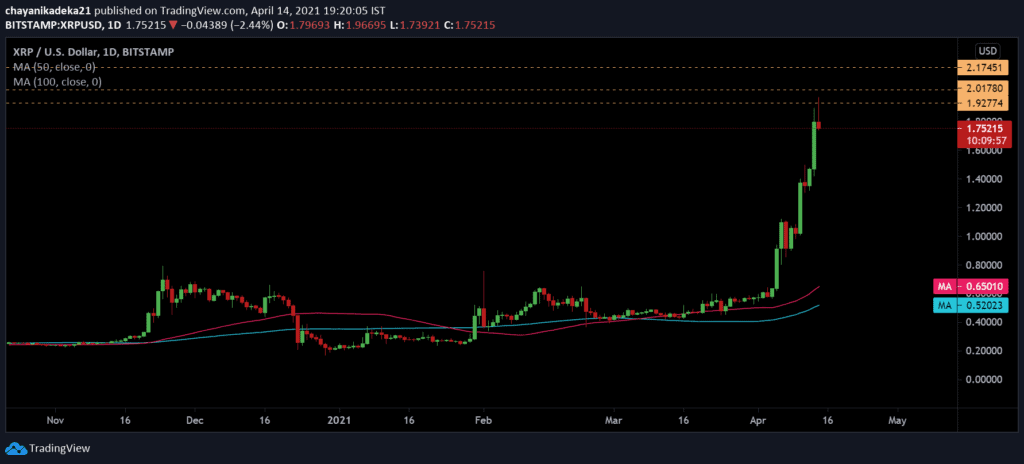
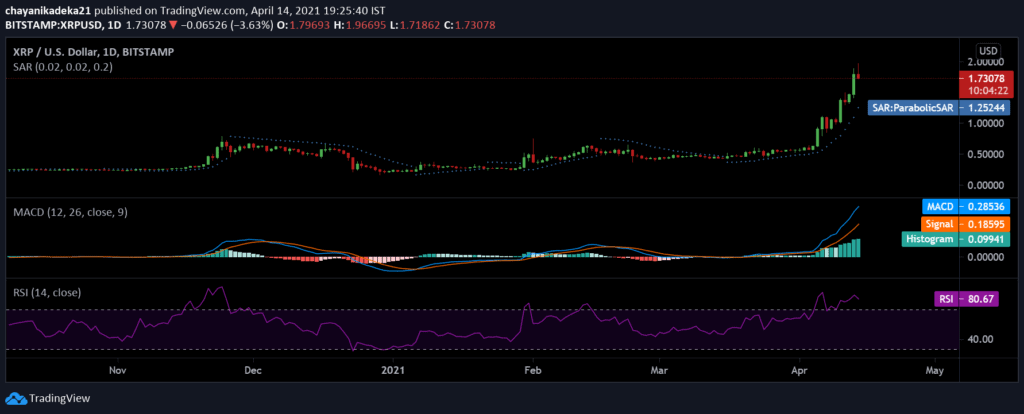
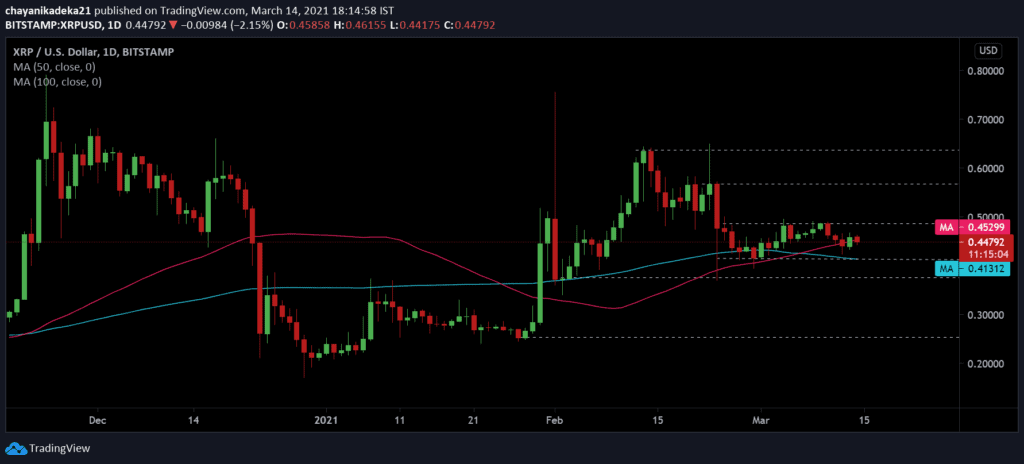
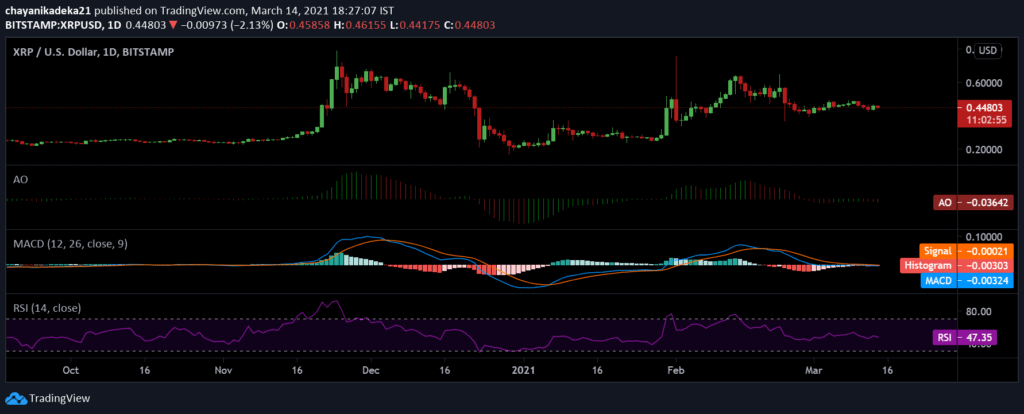
Another crypto analyst joins the discussion, focusing on the daily time frame. The support at the daily line (green) and RSI figures indicate that XRP is close to the oversold area. The analyst suggests a potential double tap on both RSI and price figures, highlighting a daily support level at $0.52.
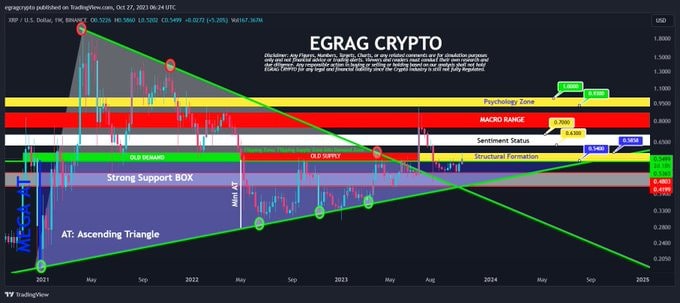
Furthermore, the analyst introduces the concept of Elliott Waves, predicting potential targets for the 3rd Wave at $1.88 and $5.85. The completion of the 2nd Elliott Wave is contingent on market conditions, with a warning that the 2nd Wave could extend towards $0.39 if markets continue to suffer.
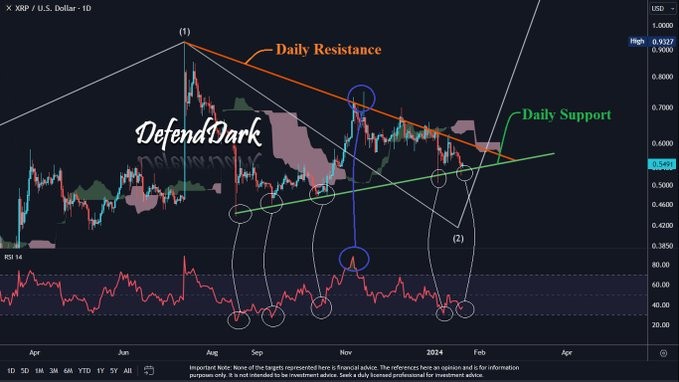
The analyst reiterates the unchanged targets for the 3rd Wave, with daily resistances at $0.60. The final line emphasizes the importance of the level at $0.6649, serving as a crucial marker in the ongoing XRP market dynamics. Investors are urged to carefully consider these insights as they navigate the intricate landscape of the crypto market.
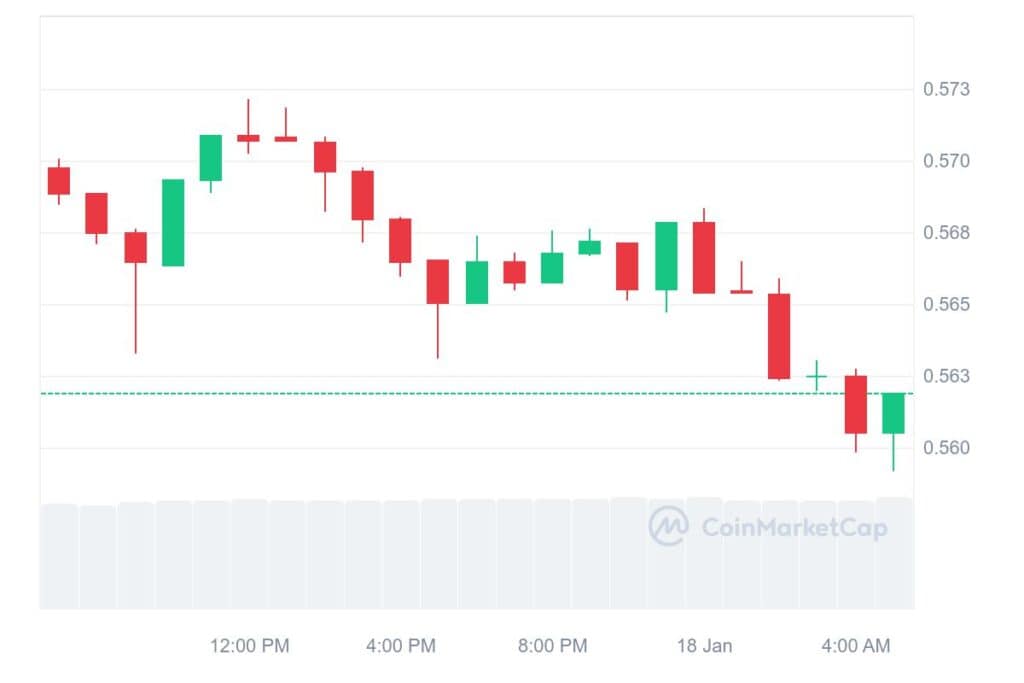
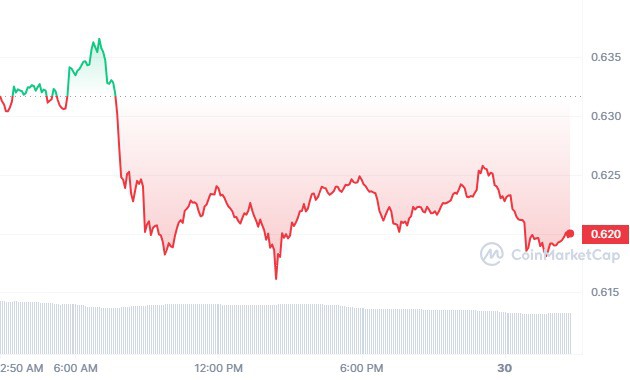
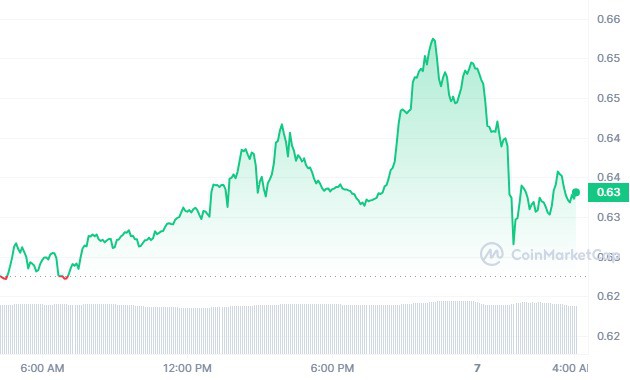
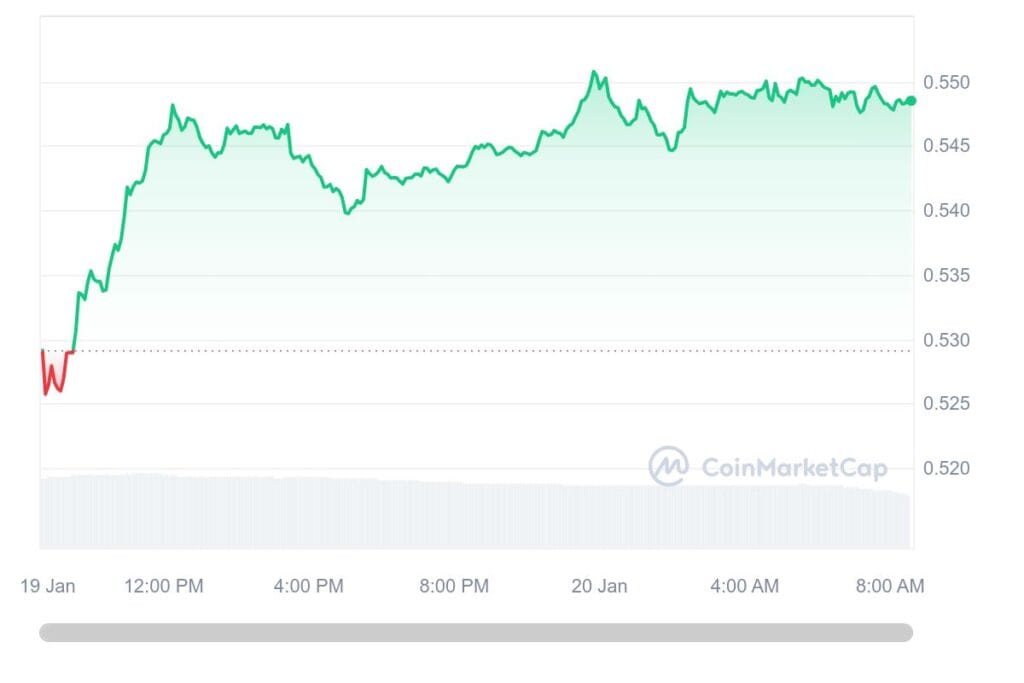
XRP is currently valued at $0.550443, and over the last 24 hours, it saw a slight uptick of 0.20%. The 24-hour trading volume stands at a substantial $1.98 billion, contributing to its overall market cap of $29.91 billion.
Related Reading | Binance.US Interim CEO Challenges SEC’s Approach To Digital Asset Regulation