
Key Highlights
- Stellar (XLM) market is likely to reach a low of $0.06 if the bearish pressures continue
- From August 1, the price of Stellar has consistently fallen from $0.083 to $0.066 demand zones
- The price of Stellar got depreciated to a new yearly low
Stellar (XLM) Current Statistics
The current price: $0.066
Market Capitalization: $1,303,865,209
Trading Volume: $114,193,113
Major supply zones: $0.09, $0.1, $0.11
Major demand zones: $0.06, $0.05, $0.04
Stellar Price Analysis August 23, 2019
XLM price had been on a steady decline. The bears had taken control of price since June 25 when the $0.12 demand zone was broken. On July 17, the market had temporary relief, as the XLM price moved up to the $0.10 demand zone. The price correction was short-lived as the bulls were resisted at the $0.10 demand zone.
The bearish pressures continued as the price fell to it’s yearly low at $0.066. However, since the $0.07 demand zone had been broken, the crypto’s price is likely to further depreciate to the next demand zone of $0.06.
Nevertheless, on August 19, the bulls were earlier resisted at the $0.072 demand zone. However, if the bulls make an attempt and break the $0.072 demand zone, the crypto’s price is likely to rise.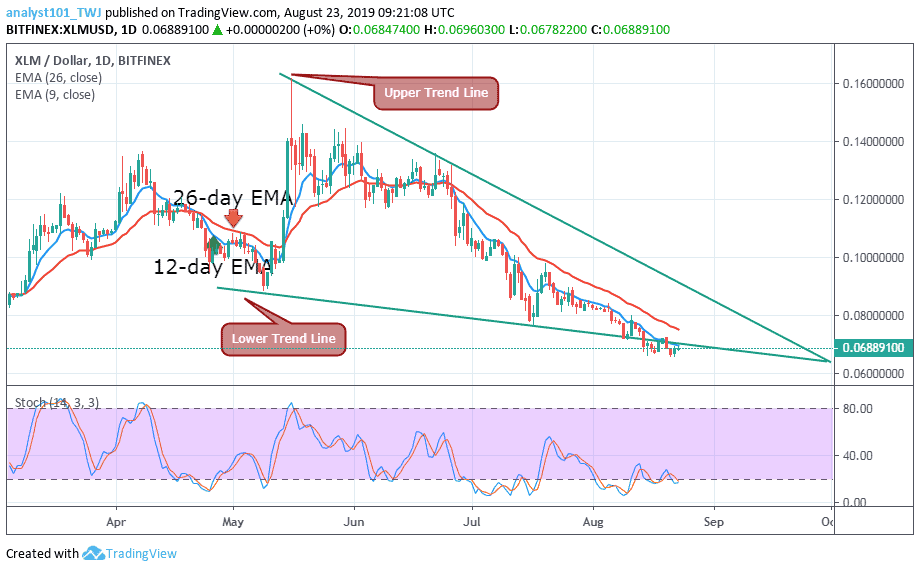
XLM Technical Indicators Reading
Each time, the bulls tested the blue colored exponential moving average the crypto’s price will fall. This had been the scenario since the blue EMA line crossover below the red EMA line. The moving average crossover had been the indicator for the overall bearish trend. The stochastic indicator has fallen below the 25% range. This implies that the XLM price is in a strong bearish momentum.
Conclusion
According to the stochastic indicator, the cryptocurrency is below the 25% range. That means XLM price will continue its gradual fall as the market approach the oversold region of the daily stochastic indicator.
So, on the downside, the market will continue its fall as the bulls failed to break the blue EMA line. On the upside, the price would have been in the bullish trend zone if the bulls had pierced the blue EMA line and red EMA line.
Disclaimer: The presented information is subjected to market condition and may include the very own opinion of the author. Please do your ‘very own’ market research before making any investment in cryptocurrencies. Neither the writer nor the publication (TronWeekly.com) holds any responsibility for your financial loss.
Never miss our daily cryptocurrency news, price analysis, tips, and stories. Join us on Telegram | Twitter or subscribe to our weekly Newsletter.