• Skip to primary navigation
  • Skip to main content
  • Skip to primary sidebar
  • Skip to footer
  • About us
  • Write for us
  • Terms and Conditions
  • Privacy Policy
  • Disclaimer
  • Contact
  • All Posts
  • Advertise

TronWeekly

Crypto World News

  • Home
  • Education
    • Best TRON Wallets
    • Beginner’s guide to TRON
  • Opinion
    • Tron Tokens
    • Market Analysis
  • Industry
    • Tron Exchange
    • Project Review
  • Press Release
  • Advertise
  • About us
    • The Team
    • Editorial Policy
    • Write for us
    • Privacy Policy
    • Disclaimer
    • Terms and Conditions
    • Contact
You are here: Home / News / Tron [TRX] Achieves Yearly High Of $0.09 Following A Daily Surge Of 29%
Tron

Tron [TRX] Achieves Yearly High Of $0.09 Following A Daily Surge Of 29%

April 1, 2021 by Sahana Kiran

Tron [TRX] was undoubtedly the star of the crypto show with a whopping 29% rise in the last 24-hours. The price of the altcoin even surged to a high of $0.096. However, at the time of writing, the asset witnessed a retracement which further caused the price of TRX to drop to $0.085. The last seven-days seemed to be beneficial for the asset as it bagged gains over 61%. The market cap of the asset also rose to $6.27 billion which further helped Tron [TRX] climb up the crypto-ladder and secure the 20th rank.

Additionally, the entire crypto market was seen mirroring a similar trend. The overall market cap of the crypto industry was at $1.90 trillion further making its way onto $2 trillion.

Tron [TRX] One-Hour Price Chart On Binance

Tron

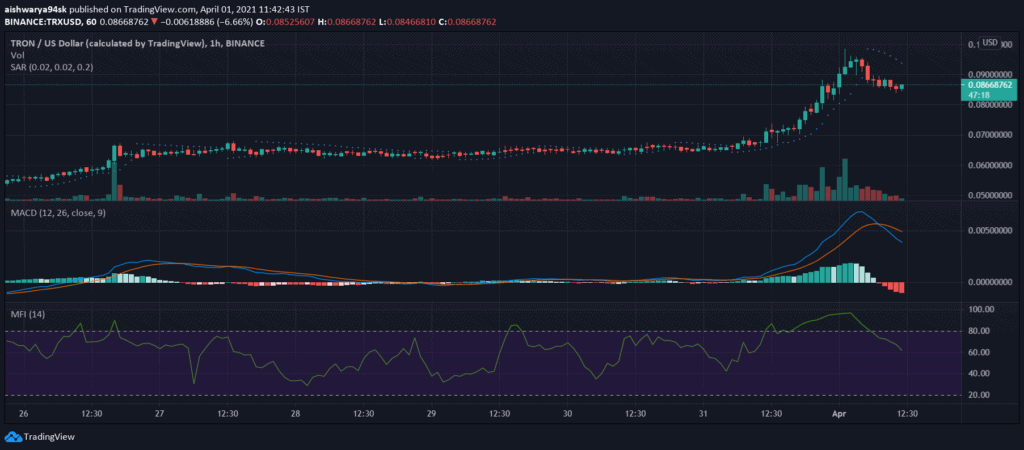
Unlike the ongoing sentiment in the market, the short-term price chart of TRX exhibited a bearish notion. The Parabolic SAR indicator formed dotted lines over the candlesticks subsiding the chances of an upward breakout. The MACD indicator imitated this predilection and went on to form a bearish crossover. Just today, the MACD line seeped below the signal line.

The Money Flow Index [MFI] indicator was in the buyers’s area despite the ongoing bearish trend in the TRX market.

Tron [TRX] One-Day Price Chart On Binance

download 6

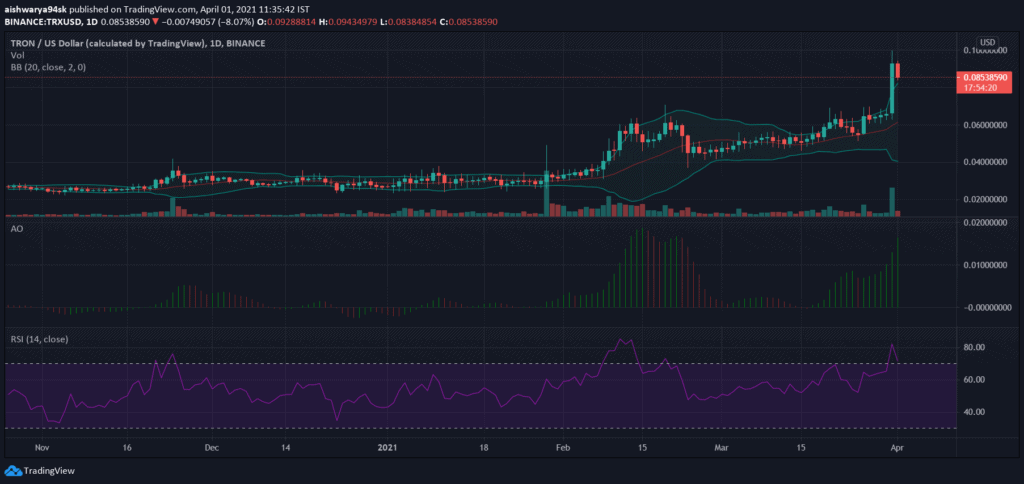
Justin Sun’s cryptocurrency, TRX revealed that it was going to preserve the bullish trend unlike its short-term price chart. The Bollinger Bands indicator was diverging and affirmed that it would continue doing so. This further indicated an increase in volatility. The Awesome Oscillator indicator formed big bold green closing bars and suggested that the bulls were in its market. The potential surge in volatility could be extremely beneficial for the altcoin.

The Relative Strength Index [RSI] indicator announced that the altcoin was being overbought as the RSI marker was over 60 median.

Furthermore, the persistence of this trend could help the coin achieve $0.1, however, the bears in the short-term price chart could deter this growth.

Filed Under: News, Altcoin News, Market Analysis Tagged With: TRON (TRX)

Primary Sidebar

Recent Posts

  • Uniswap [UNI] Garners Maximum Gains While Bears Haunt The Crypto Market April 23, 2021
  • Is Ethereum a Better Asset Allocation for Performance Right Now? April 22, 2021
  • Turkish Crypto Exchange Users Succumb to Losses After CEO Absconds April 22, 2021
  • Tron [TRX] Bulls Stagnate Near $0.12 After Remarkable Comeback April 22, 2021
  • Bitcoin To Encounter “Major Correction” Warns Guggenheim’s Scott Minerd April 22, 2021


Footer

News

  • Altcoin News
  • Bitcoin News
  • Blockchain
  • Tron News
  • World

Digest

  • Meet the Founder
  • Price Winning Article
  • DeFi
  • Cyber Security
  • Crypto Scam

Industry

  • Project Review
  • Technology
  • Fintech
  • Tron Exchange
  • New in Town

Tron Universe

  • Event and Tron Parties
  • New in Town
  • Tron Tokens

Follow Us

Subscribe US

Copyright © 2021 · Tron Weekly. All Rights Reserved. NOTE: Tron Weekly is an independent crypto news site that adheres to the strict journalism policy anchored on transparency, trust, and objectivity, we have no affiliation with the TRON Foundation, its founder Justin Sun or any other cryptocurrency firm.