
A reversal of trend was noted in the crypto market. However, coins like Uniswap [UNI] and XRP continued walking downhill. But all the other assets were seen on an uptrend. Bitcoin [BTC] was trying to find a way back over $60K. Binance coin [BNB], as well as Tether [USDT], were still fighting for a spot as the third-largest cryptocurrency. Additionally, the overall market cap of the crypto industry was recorded at $1.76 trillion.
Uniswap [UNI] found a way back into the top ten. At the time of writing, UNI was spotted in the eighth position. The market cap of the altcoin was $16.26 billion. The price of the asset was seen in the red sea. During press time, UNI was trading for $31.56 with a 4.80% drop in the last 24-hours.
Uniswap [UNI] One-Hour Price Chart
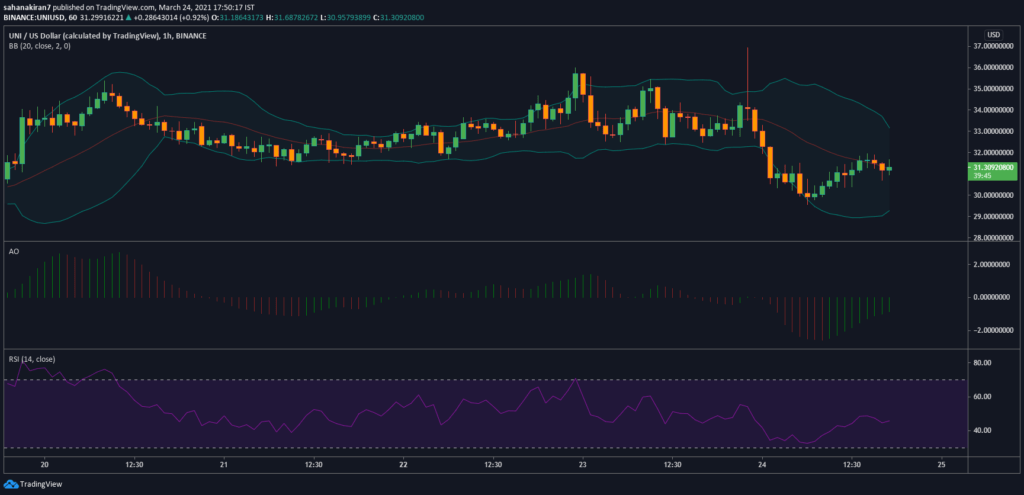
Strong bullish sentiment was found in UNI’s short-term price chart. On the one-hour price chart of UNI, the Bollinger Bands indicator was going in for a convergence. The bands were wide apart all these days indicating an increase in volatility. However, UNI at present was getting closer further intimating poor volatility. The Awesome Oscillator indicator laid out green closing bars suggesting bullish momentum.
The Relative Strength Index indicator was down below the sellers’ zone exhibiting a sellers’ market despite the presence of the bulls.
Uniswap [UNI] One-Day Price Chart
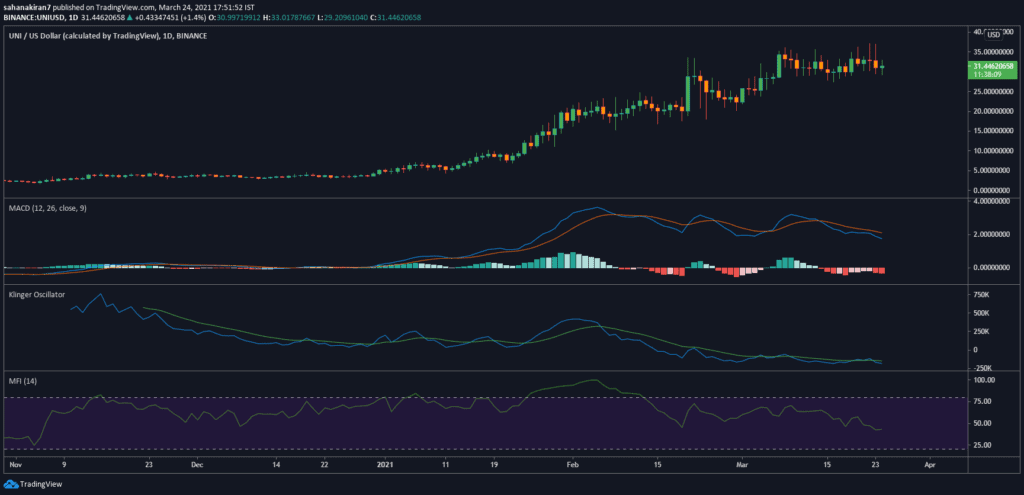
The one-day price chart of UNI had bears residing in its market. The MACD line slumped below the signal line. This further pointed out that the bears had made an entry during the middle of the month. This bearish crossover was further mirrored by the Klinger Oscillator. The Money Flow Index was also in the sellers’ arena, similar to the one-hour price chart of UNI.
Just yesterday, UNI hit an all-time high of $36.41, however, the bears seemed to have pushed the altcoin back below $35.