
APT price prediction remained in focus, as traders watched whether Aptos could confirm a stronger recovery from its accumulation range. Analysts pointed to key breakout and support levels, while momentum indicators showed buyers building control.
As of press times, the Aptos trades near $1.13 after a 2.24% daily drop, while trading volume rose 160.93% to $216.63 million. According to CoinMarketCap data, the token gained 15.87% over the past seven days.

Also Read: Ethereum Price Analysis Shows ETH Testing $2,450 Breakout Zone
APT Price Prediction Shows Accumulation Setup
According to analyst Crypto Patel, APT could be in a generational accumulation zone. His high-timeframe view placed the token near $1.10 after an estimated 81% correction from its all-time high.
Patel set the high-risk range for the accumulation between $0.70 and $0.85. He said the next major target is $18, and it remains alive as long as the price keeps above $0.70.
The analyst also highlighted the 2025 capitulation followed by the formation of a descending channel, liquidity sweep, and accumulation phase. He had set his targets for upsides of $2, $5, $10, and $18 or more from the bottom end.

The $2 area is the first bullish flip trigger in that setup. If the price drops below $0.70, the structure would become weak, but a price recovery to this level would support the initial price forecast for the APT.
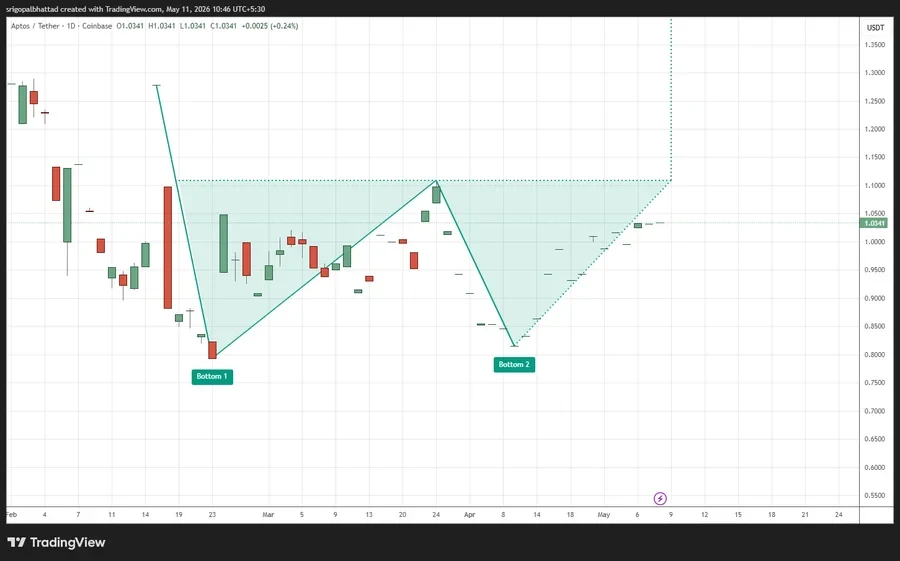
Additionally, another analyst, Crypto with Gopal, has mentioned that APT is exhibiting a potential double bottom structure. He said that buyers were defending a key area, and there was strength building in a higher low after the second bottom.
A break above the neckline would validate a bullish reversal. APT is in an accumulation phase with an upside bias, and confirmation is key to the APT price prediction until that move occurs.
Aptos Momentum Builds as RSI and MACD Improve
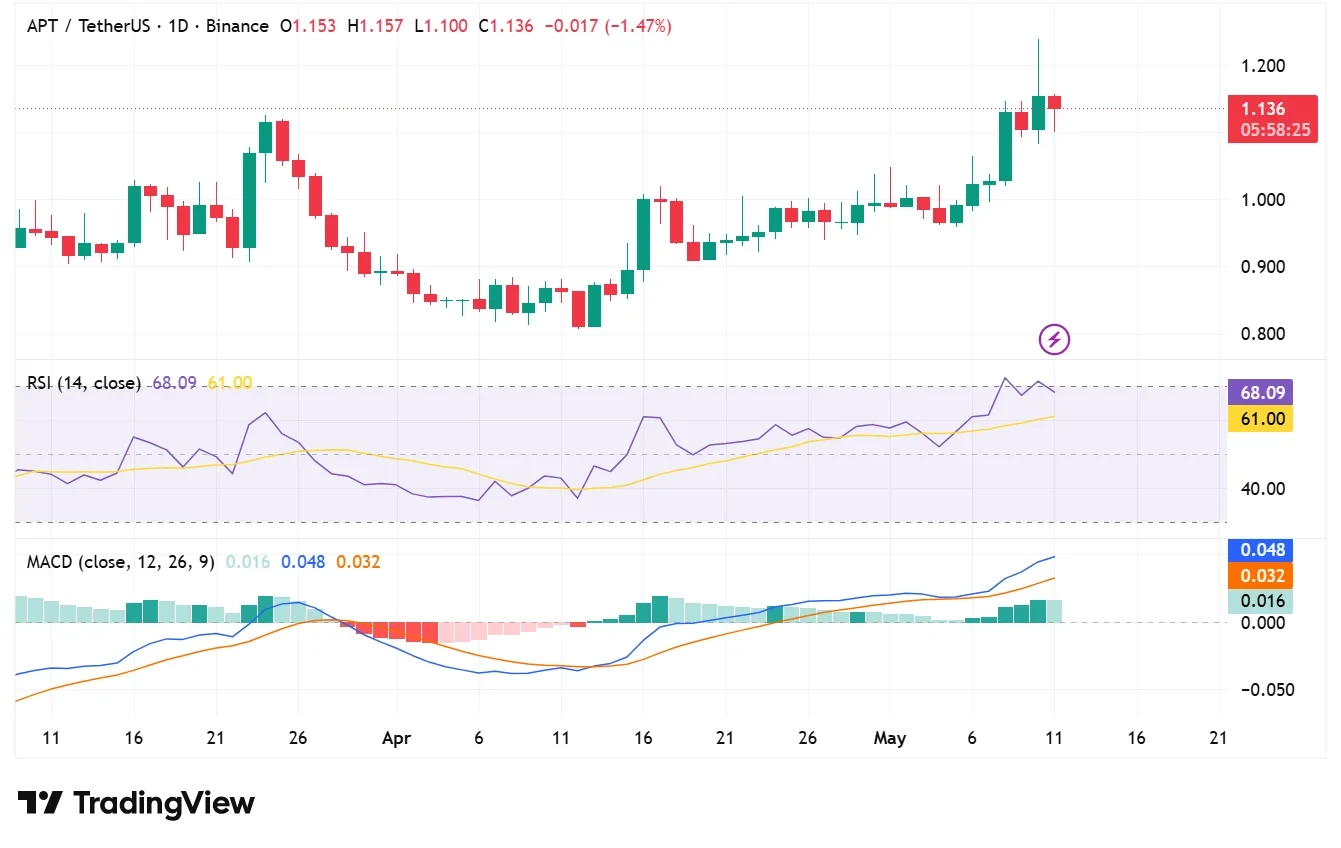
According to TradingView data, the Relative Strength Index (RSI) is at 68.09, with the RSI moving average at 61.00. The reading formed near the top of the neutral zone but remained below the 70 level that is typically seen for overbought situations.
The Moving Average Convergence Divergence (MACD) data indicates that the MACD line is at 0.048, the signal line is at 0.032, and the histogram is at 0.016. The MACD line stayed above the signal line, indicating positive momentum on the daily chart.
APT price prediction now hinges on whether or not it’s able to withstand the lower accumulation floor and move the price up to $2. The current data shows stronger volume and weekly gains, but the analyst views still require a confirmed breakout.
This article contains market analysis and price predictions. These are not guarantees. Crypto markets are volatile. Always DYOR. Not financial advice.
Also Read: FLOW Price Eyes $0.0466 as Bullish Structure Signals Liquidity Move