Bittensor (TAO) holds long-term support around a key level as consolidation continues after volatility. Momentum indicators remain neutral to slightly bearish, suggesting indecision for the TAO price breakout. Rising open interest contrasts with weaker trading volume, showing cautious participation while traders await a breakout from the current range.
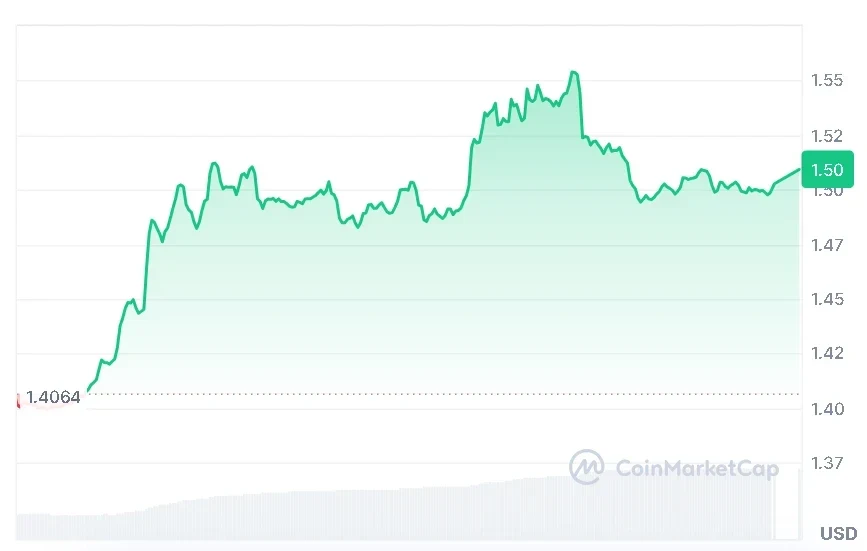
At the time of writing, TAO is trading at $256.18 with a 24-hour trading volume of $172.6 million and a market capitalization of $2.8 billion. After the 2.84% gain over the last 24 hours, the TAO price structure and rising open interest point to a bullish reversal.
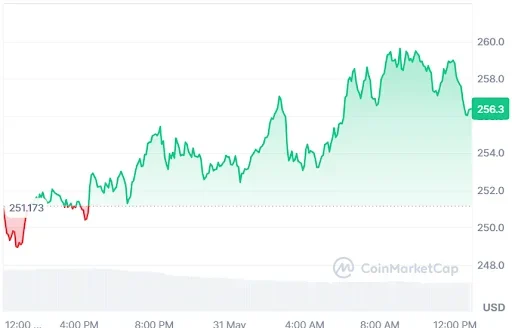
Source: CoinMarketCap
TAO Price Holds $200 Support as Breakout Setup Builds
Furthermore, the crypto analyst DREAD BONGO pointed out that the TAO price is holding a critical long-term structure above the $200 support zone, which has acted as a multi-year accumulation floor through repeated volatility.
Market participants are closely watching whether the TAO price can break the existing downtrend and confirm a shift in structure, potentially marking the beginning of a broader bullish regime change.
Source: DREAD BONGO’s X Post
In the event that happens, then momentum could carry the TAO price into a return to the upper bound of its price channel and eventually into yet another attempt at testing all-time highs, at which point resistance will likely remain strong.
Half a year after its first halving, reduced emissions are gradually squeezing the supply picture, alongside further subnet halvings and ecosystem growth.
Also Read: Bittensor (TAO) Price Eyes $312 Breakout Amid Improving Bullish Momentum
RSI and MACD Point to a Consolidation Phase
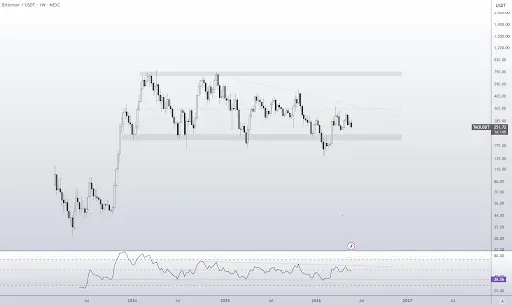
According to TradingView, there is considerable volatility in TAO starting from early 2026 till late May. Having touched $145.00 during February, the TAO price soared to exceed $350.00 in March.
It came down to be at about $230.00, and another rise in May up to $310.00 was unsuccessful. Currently, the TAO price ranges within $258.07, having gained +1.53% on the day.

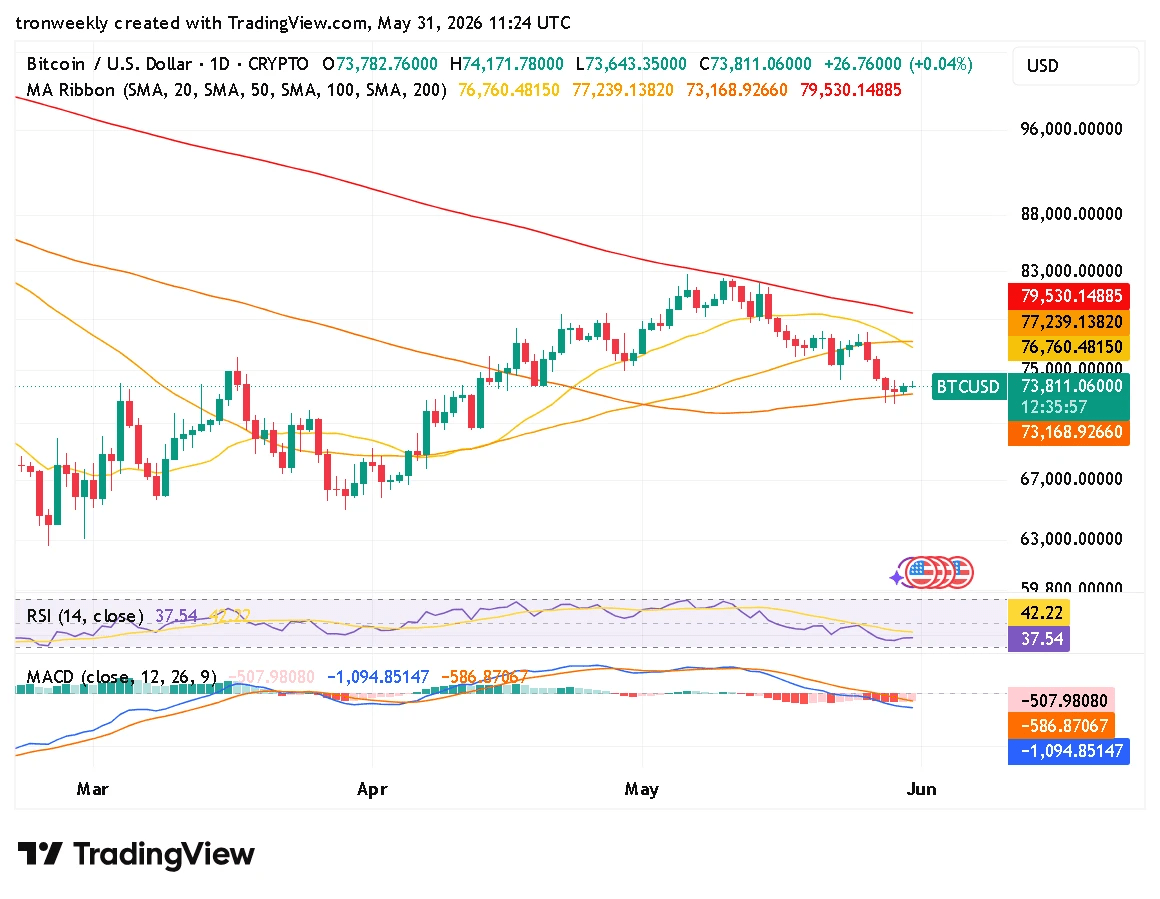
Source: TradingView
According to technical indicators, the market favors a neutral to bearish trend. RSI is currently at 43.32, slightly below its signal line of 45.08, without entering oversold conditions.
On the other hand, the MACD line is trading at -6.18321, below its signal line of -3.43457, with zero histograms representing market compression until a breakout occurs.
TAO Derivative Data Point to Cautious Outlook
However, the open interest of TAO increased by 2.83% to $316.61 million. It denotes that there is an increase in the level of trader participation and derivative trades, which shows that the market players have regained their confidence.

Source: Coinglass
The trading volume decreased by 35.79% to $728.73 million. This decrease indicates that there is less participation in the market and a slowed pace compared to previous levels, indicating that the asset is experiencing a phase of consolidation.
This article contains market analysis and price predictions. These are not guarantees. Crypto markets are volatile. Always DYOR. Not financial advice.
Also Read: Bittensor (TAO) Price Outlook: Can Bulls Defend $234?