- Arbitrum (ARB) trades near $0.51, consolidating at a crucial support-resistance level.
- Technicals point to a possible breakout if the price clears $0.54.
- Long-term upside could extend toward $2.27 if momentum continues.
Arbitrum (ARB) is currently priced at $0.51, showing mild weakness after its gradual recovery over the last two months. The weekly chart highlights that the token is sitting at a major support-resistance flip zone, an area that often decides the next big move. Traders are closely watching whether ARB can maintain this range or face another rejection.
Market data shows that the coin is holding above the 20-day exponential moving average (EMA) at $0.43 but is struggling near the 50-day EMA at $0.53.
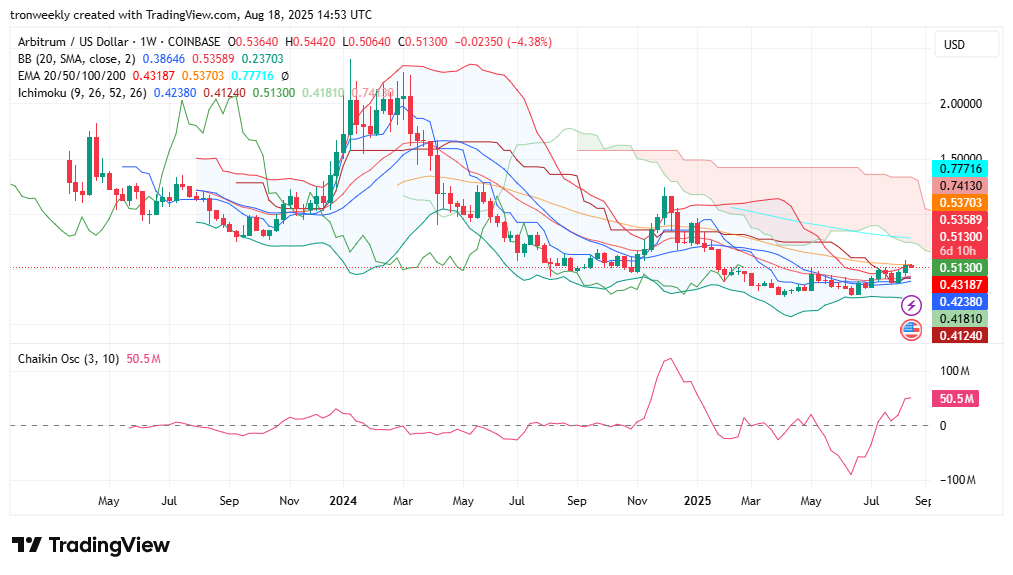
This region also aligns with the lower edge of the Ichimoku Cloud, creating a strong barrier. A sustained move above this level would be the first sign of a trend reversal. On the other side, losing $0.43 could expose ARB to declines toward $0.38.
Also Read: Arbitrum Eyeing $0.60 Resistance: Will ARB Soar or Face a Pullback?
Arbitrum Technical Indicators Show Mixed Signals
A few indicators are providing a mixed perspective on the market now. Bollinger Bands indicate balanced movement, with price oscillating around the middle band. The Relative Strength Index is at 54.4, just above neutral, demonstrating gentle bullish sentiment without going overbought.
The MACD remains in bullish favor, with the MACD line still above the signal line and green histogram bars affirming increasing momentum. Bullish money flow also exists, with the Chaikin Oscillator at +50M, affirming capital inflows are supporting the market.
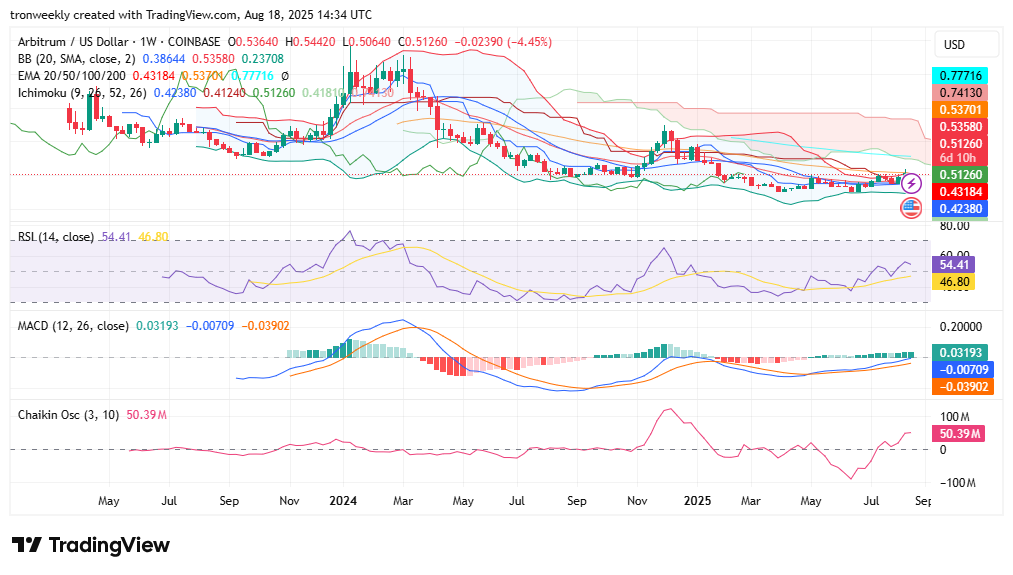
The resistance is on the EMA50 and Ichimoku Cloud in the area of $0.53–$0.54. A break and hold above it can open the way towards the short-term target of $0.65. In the long term, resistance remains around $0.77, aligning with the 200-day EMA and also being a psychological level among traders.
Upside Targets Could Reach Over 400%
As per market analysts monitoring chart patterns, Arbitrum has just broken above a weekly falling wedge configuration. Considered across the board, this highly popular bullish reversal formation points toward a potential gain of up to almost 400% if the trend persists. That kind of action would send ARB up toward $2.27, a price level unseen in recent months.
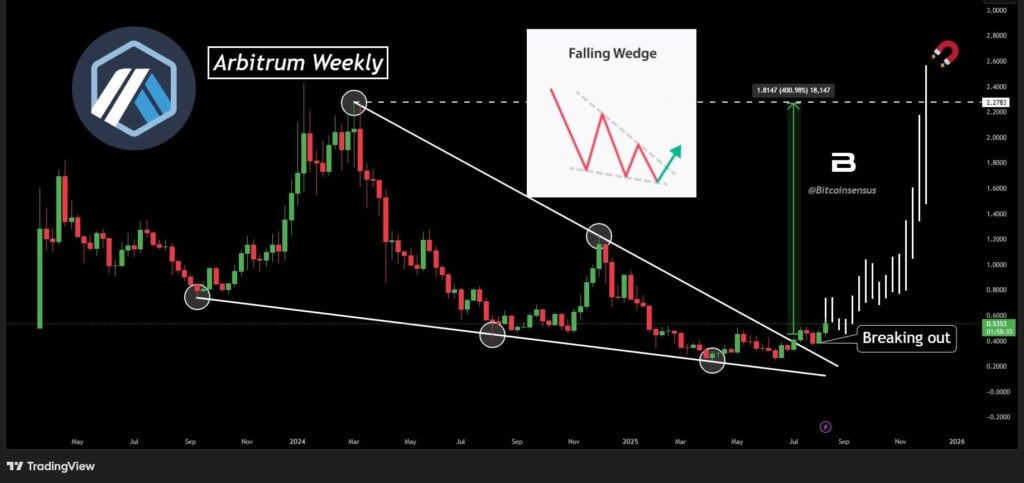
For now, traders are watching $0.53–$0.54 as the immediate decision point. A failure to overcome this zone could see price retreat back to $0.43, while a successful breakout may open a stronger rally into the final quarter of the year.
Also Read: Arbitrum (ARB) Price Analysis: Is $0.60 the Next Key Resistance Level?