
- BNB breaks past $800, reaching a new all-time high at $804.95.
- Market cap surges to $117.65B, overtaking Solana in rankings.
- Technical indicators show bullish momentum, but RSI signals overbought.
Binance Coin (BNB) surges above $800 and reaches a new record high. It’s rally comes after weeks of macro-driven volatility rocking the crypto space. This breakout shows new bullish stimulus and rising confidence from investors. Traders and analysts look at BNB actively for additional upside.
At the time of writing, BNB is at $794.02, up 4.77% over the past 24 hours. 24-hour volume for the coin is $4.71 billion with a $117.65 billion market capitalization, re-entering the list of the highest performing digital currencies. The surge follows a broader crypto market recovery as major coins regain momentum.

Binance Coin Still Undervalued After Breaking $800 Barrier
Underlying this bullish sentiment is research from Thesis.io, the world’s first AI-native research engine for DeFi. The platform pointed out BNB’s new record high, citing the fact that it broke through the $800 barrier and reclaimed the $111 billion market cap region by successfully usurping Solana (SOL) in the rankings.
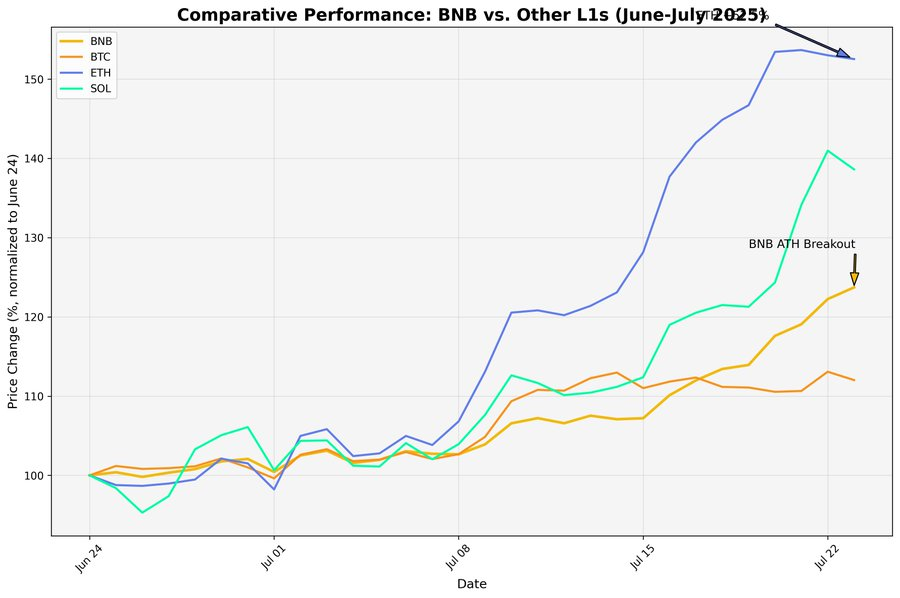
The market may still underestimate BNB’s actual value and strategic position according to Thesis.io, particularly considering its broad-based utility in Binance’s worldwide infrastructure and increasingly prominent role within the DeFi ecosystem.
“It’s starting to feel like the market’s underpricing how strong BNB’s positioning is,” stated Thesis.io in a recent market update.
Also Read | BNB Builds Bullish Momentum: Will It Smash Through $750 Resistance?
Binance Coin Rally May Pause After Sharp Surge
Technically, Binance Coin (BNB) remains in a healthy uptrend and is currently at $794.02 after reaching a day’s high at $804.95. The price is noticeably above the 20-day EMA at $717.47 and the 50, 100, and 200-day EMAs, again emphasizing continued bullish sentiment.
The Bollinger Bands suggest BNB has broken out through the top band at $789.06, which at times is a sign of short-term overextension. That can usher in a short correction or sideways movement. The low band at $620.11 is a distant level of support.
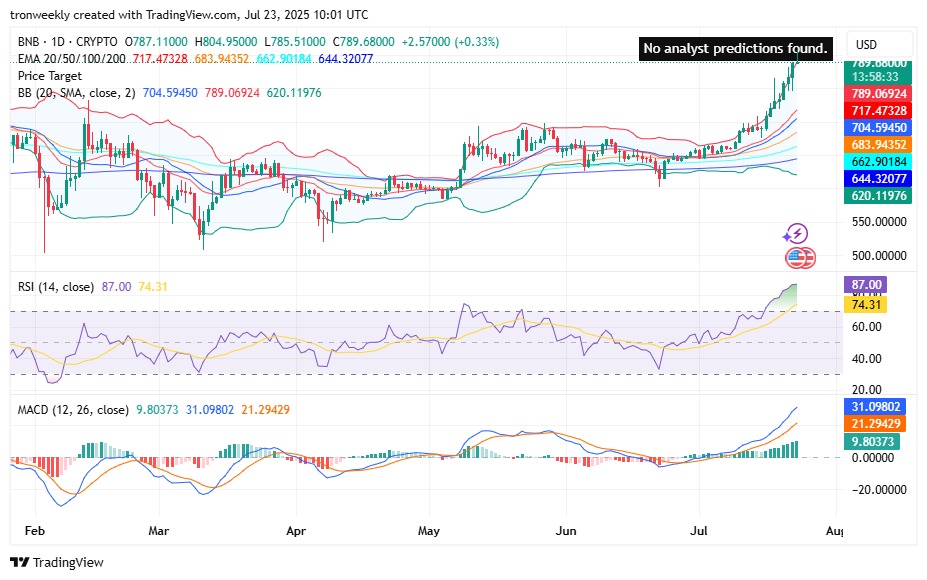
These indicators verify the uptrend but suggest overextension. The RSI is at 87.00 in extreme overbought conditions, which raises the potential for correction. The MACD remains bullish, with the MACD line at 31.09 and the signal line at 21.29, in favor of continued buying pressure.
Spot support for BNB is $717 and resistance at the psychological level of $800. As long as the price holds above the 20-day EMA, the uptrend is on; a minor correction would not be impossible with current readings on indicators.
Also Read | BNB Enters Stock Market Game: Windtree Leads With Bold NASDAQ Strategy