
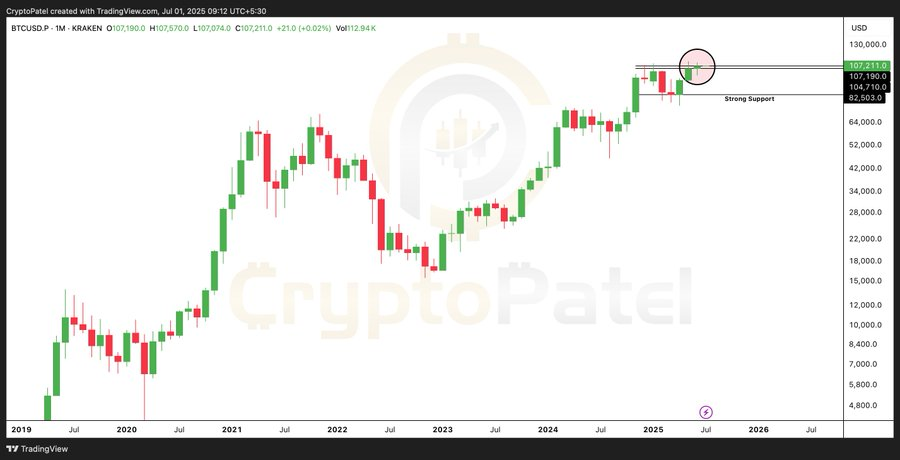
- Bitcoin hits an all-time high monthly close, setting the stage for a potential $130K milestone.
- The next move of Bitcoin is dependent on a vital support point of $106K, although lower levels of $102K are in focus.
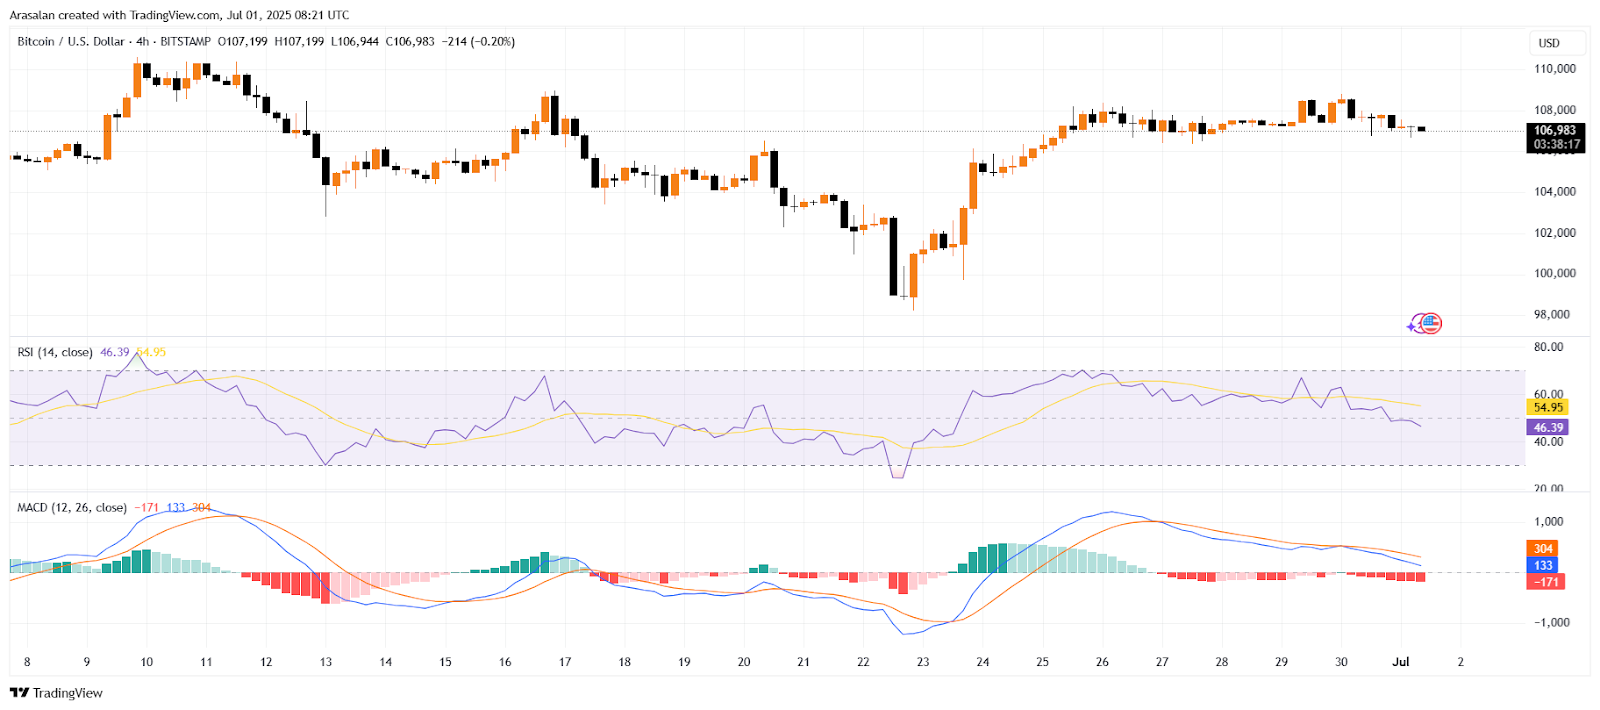
- The RSI and MACD bearish signals are seen behind the Bitcoin, with the possibility of downward pressures in the short run.
Bitcoin has recorded the highest monthly close in its history, and this has attracted more optimism among market analysts. Crypto Patel emphasized the fact that the cryptocurrency might hit the $130,000 milestone earlier than projected. Bitcoin is in a position to make continuous price increases with its current momentum. It, however, encounters decisive levels of prices that will dictate its future in the forthcoming weeks.
Source: X
The latest price action shows that Bitcoin is trying to consolidate around the $106,000 support area, which is also one of the primary areas traders are paying attention to. A fall to this level may put lower levels of support at $104,000 and $102,000. The sustainability of these support levels will play a key role in defining whether the market will continue to be bullish or will start moving downwards.
Also Read: Bitcoin’s Big Move: Will $93,000 Dip Be the Key to a $150,000 Rally?
Bitcoin Nears Key Resistance at $108K
The Bitcoin price action is focused around the price resistance area at the level of $108,000. If the cryptocurrency surpasses this height, the possible breakout will take BTC to between $110,000 and $130,000. Nevertheless, this is subject to the favorable market conditions and may require time to materialize. The traders will keep an eye on every indication of upward momentum.
Source: TradingView
According to the Relative Strength Index (RSI), currently the index is 46.39, which characterizes the neutral market. That indicates that BTC is not overbought nor oversold. Nonetheless, the RSI has a slight negative indication, which implies the pressure towards the bear. When RSI levels fall under 40, then this may indicate future selling pressure and a reverse turn towards a downtrend.
The moving average convergence divergence (MACD) analysis raises more concerns in the short term. The MACD line goes below the signal line, indicating a bear crossover. This indicates a potential downside trend that is being buttressed by the negative histogram bars that imply the bullish momentum is weakening. Consequently, BTC might exert pressure downwards in the near future.
Bitcoin Faces Liquidity Slowdown
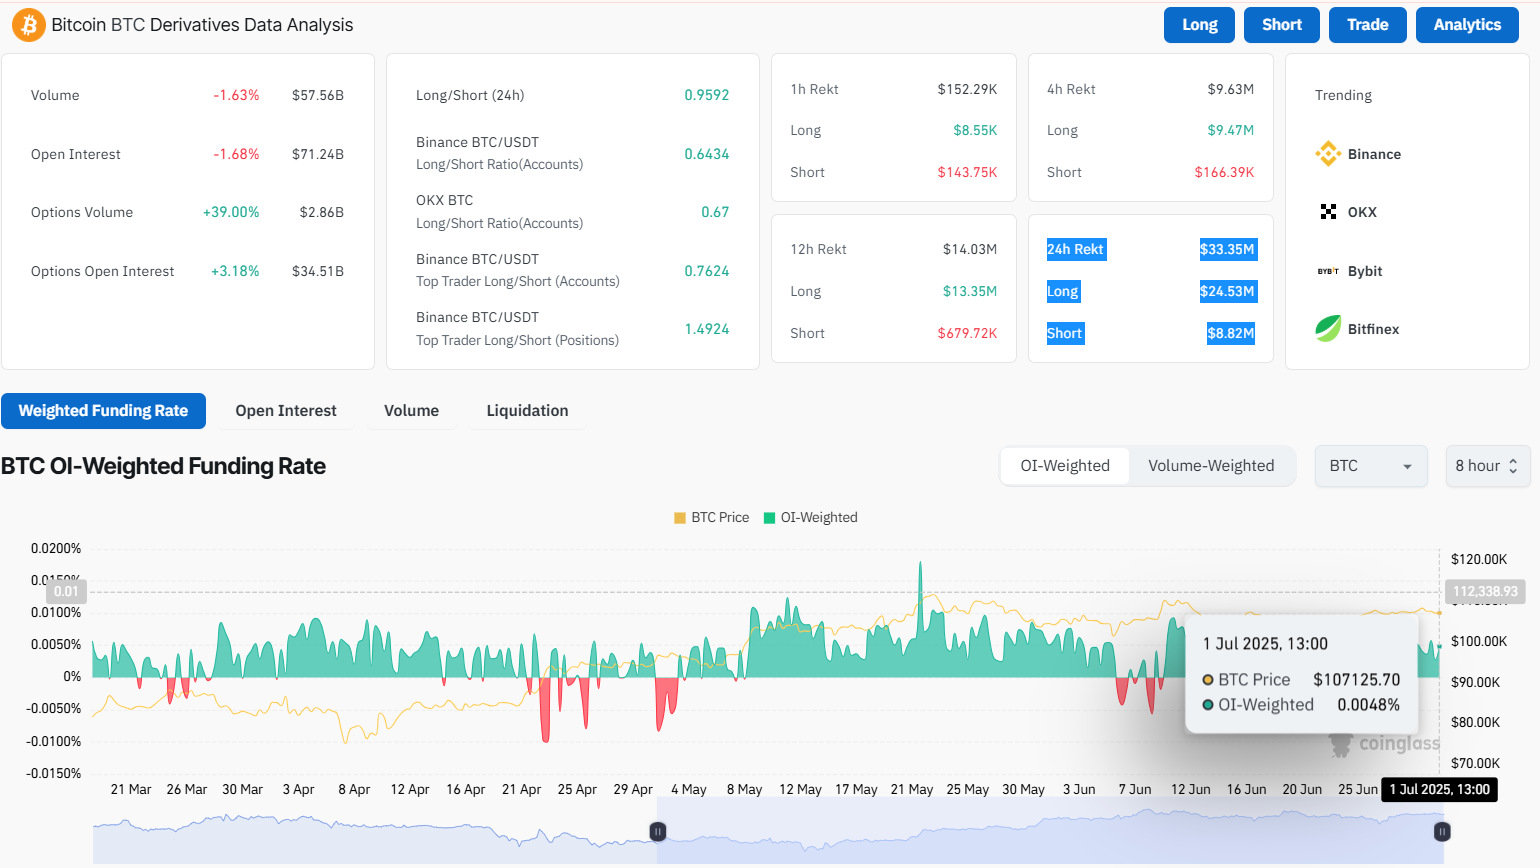
Liquidity data indicates a small decline in volume and open interest. The volume of trading in Bitcoin has decreased by 1.63% to reach a level of $57.56 billion. The open interest has also reduced, which is given as $1.68 and stands at $71.24 billion.
Source: Coinglass
In the last 24 hours, there were $33.35 million of liquidations of BTC. Long positions contributed to this to the tune of $24.53 million, and short positions contributed to the tune of $8.82 million. This indicates the prevailing volatility and traders varying their position to BTC price volatility. The market is difficult to read, but the future of BTC seems viable.
The further actions of BTC will prove crucial as it is approaching critical prices. The breakthrough may set the stage for a rally to the level of $130,000. Nonetheless, the market’s bearish sentiments and conservative stance indicate that it might continue to be volatile before the coin can break out on an upward trend. Market traders should stay alert when market forces play out.
Also Read: $2.7B Pours into Crypto: Bitcoin Grabs 83% Despite Mining Pressure