• Skip to primary navigation
  • Skip to main content
  • Skip to primary sidebar
  • Skip to footer
  • About TronWeekly
  • Write for us
  • Terms and Conditions
  • Privacy Policy
  • Disclaimer
  • Contact
  • All Posts
  • Advertise

TronWeekly

Crypto World News

  • Home
  • Latest News
  • Opinion
    • Education
    • Best TRON Wallets
    • Beginner’s guide to TRON
    • Tron Tokens
    • Market Analysis
  • Industry
    • Tron Exchange
    • Project Review
  • Press Release
  • Bitcoin (BTC)
  • Ripple (XRP)
  • Advertise
  • About TronWeekly
    • The Team
    • Editorial Policy
    • Write for us
    • Privacy Policy
    • Disclaimer
    • Terms and Conditions
    • Contact
You are here: Home / Cryptocurrency News / Bitcoin (BTC) Bottom Structure May Signal Next Market Cycle

Bitcoin (BTC) Bottom Structure May Signal Next Market Cycle

What to know:

  • Bitcoin may be forming a long-term bottom structure
  • Analysts say the pattern resembles previous market cycle transitions
  • A completed base could precede the next multi-year uptrend

By Malavika Nair | Edited By Ammar Raza,March 13, 2026, 4:30 PM

Bitcoin

The price formation of Bitcoin (BTC) may be forming a pattern that conventionally goes back to the start of a new long-term market cycle.

Latest chart analysis shared by market analyst Ted Pillows proposes that the coin could be building a bottom structure. This structure is similar to prior cycle transitions before entering a potential multi-year uptrend.

The asset has gone through major volatility in recent months, with the token moving through spans of correction and consolidation after reaching previous highs. Analysts often study long-term chart formations during such periods to identify whether the market is nearing a cyclical turning point.

This is how the $BTC bottom structure will probably look.

After this, the next multi-year uptrend will start. pic.twitter.com/2w2K5qY1Qw

— Ted (@TedPillows) March 12, 2026

Also Read: Bitcoin Bearish Call Intensifies as Bloomberg Strategist Repeats $10,000 Forecast

Historical Patterns in Bitcoin Cycles

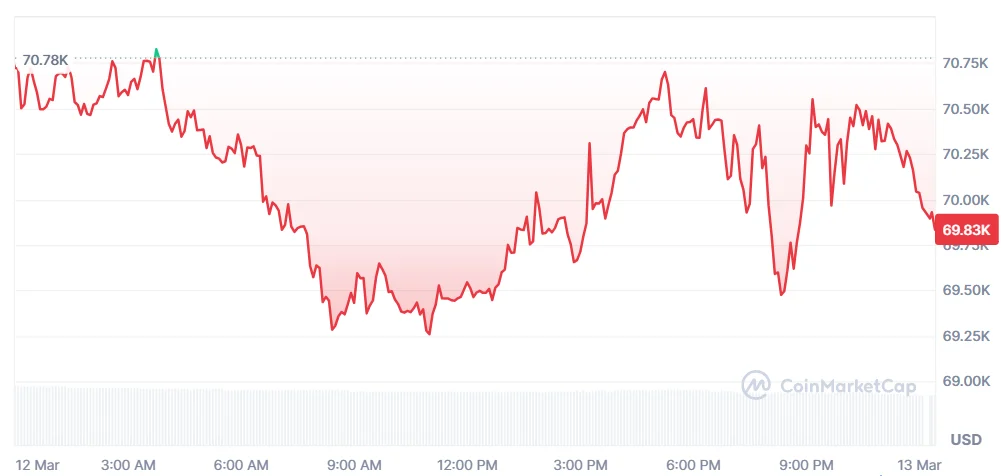
According to the data given by CoinMarketCap, at the time of writing, the coin is trading at $69,845.41 with a 1.03% decrease in rate. The daily trading volume of the token is around $40.17 billion, and the market cap of the coin has exceeded $1.39 trillion.

bitcoin
Source: CoinMarketCap

The asset’s price history has been characterized by defined market cycles containing expansion phases followed by corrections and consolidation. These cycles usually unfold over many years and are influenced by market sentiment, investor demand, and macroeconomic developments.

According to the chart analysis shared by Ted Pillows, the coin’s present price action resembles bottom formations seen in prior cycles. The pattern proposes a slow stabilization phase before the chance of the start of a larger upward trend.

Earlier charts indicate that the token has earlier formed base structures after large market corrections before eventually entering broadened bullish periods.

Market Participants Watch Long-Term Signals

Long-term chart formations are extensively observed by traders and analysts seeking to assess larger market developments and scenarios. Patterns forming on multi-year timeframes can give insights into potential future market phases.

As BTC continues to move through its present consolidation period, analysts will continue analyzing whether the developing structure aligns with previous cycle patterns. Confirmation of a bottom structure typically requires sustained stability and the gradual return of bullish momentum.

For now, traders and investors are focused on whether Bitcoin’s current price behavior will change into a foundation for the next major market cycle.

This article contains market analysis and price predictions. These are not guarantees. Crypto markets are volatile. Always DYOR. Not financial advice.

Also Read: Bitcoin Holds Firm Between $62K–$72K As Buyers Return

Filed Under: Cryptocurrency News, Bitcoin (BTC)

About Malavika Nair

Malavika S is a Data Analyst at Tronweekly, providing data-driven insights into cryptocurrency markets and digital assets. Her work focuses on Bitcoin, altcoins, meme coins, and DeFi, while tracking Layer 1 and Layer 2 blockchain projects, DeFi tokens, and key technical indicators. She adds analytical context to market movements and macro trends, translating complex data into clear, reader-focused coverage. Malavika holds a Master’s degree in Communication and Media Studies.

Primary Sidebar

Recent Posts

  • Securitize and Computershare Partner to Expand Tokenized Equity in US April 29, 2026
  • Bitcoin Price Outlook Turns Critical as Volume Drops, SOPR Signals Recovery April 29, 2026
  • Ethereum L2 Fees Drop Below $2K as Daily Rent Falls 99% April 29, 2026
  • Hyperliquid Launches on Trust Wallet With 0% Fees Offer April 29, 2026
  • STRC Dividend Vote Opens as Saylor Proposes Semi-Monthly Shift April 29, 2026

Footer

News

  • Latest News
  • Altcoin News
  • Bitcoin (BTC)
  • Blockchain
  • Tron (TRX)
  • World

Digest

  • Meet the Founder
  • Price Winning Article
  • DeFi
  • Cyber Security
  • Crypto Scam

Industry

  • Project Review
  • Technology
  • Fintech
  • Tron Exchange
  • New in Town

Tron Universe

  • Event and Tron Parties
  • New in Town
  • Tron Tokens

FOLLOW US

  • Facebook
  • Telegram
  • Twitter
  • Linkedin

Subscribe US

Editorial Policy | Privacy Policy | Disclaimer | Terms and Conditions | Masthead

Copyright © 2026 · Tron Weekly. All Rights Reserved. NOTE: Tron Weekly is an independent crypto news site that adheres to the strict journalism policy anchored on transparency, trust, and objectivity, we have no affiliation with the TRON Foundation, its founder Justin Sun or any other cryptocurrency firm.