
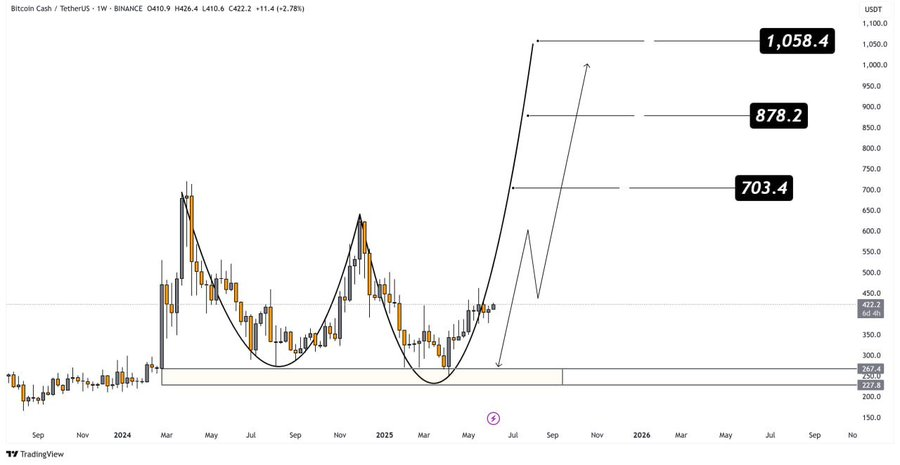
- Bitcoin Cash’s cup & handle pattern signals a potential breakout, with targets at $703.40, $878.20, and $1,058.40.
- RSI at 59.56 shows rising optimism, indicating BCH could continue its upward trend if it stays above 60.
- MACD divergence suggests strong bullish momentum, with BCH poised for a breakout if the trend persists.
Bitcoin Cash (BCH) is looking strong, as there are signs of a bullish breakout. Analyst Rose Premium Signals highlighted that the cryptocurrency’s current pattern indicates it might be getting ready for a major breakout. If the current trend for BCH continues, analysts expect significant growth shortly. The trend suggests that BCH may experience a rally, potentially approaching higher prices.
Being a bullish indicator, the cup and handle pattern can provide guidance on when prices will increase. The BCH price hasn’t fallen below the critical level of $350. This area is vital since continued support establishes an intact bullish structure. As long as BCH remains above this level, it can overcome resistance and go higher. If the breakout occurs, analysts expect targets at $ 703.40, $ 878.20, and $ 1,058.40.
Source: X
RSI Indicates Bullish Momentum
The Relative Strength Index (RSI) of Bitcoin Cash is currently 59.56, which means the market is bullish. The RSI being over 50 suggests that BCH is on an upward trend. At this level, buyers become active, which could lead to an increase in cryptocurrency. As the RSI comes close to 60, some traders check for additional signals that prices are rising quickly. If the price remains stable above 60, it would signal that BCH is continuing in an upward trend.
A rising RSI for BCH indicates higher demand, and if this trend holds, BCH could easily overcome the resistance and increase in value. When the RSI is higher, BCH is showing strength, so there is potential for more significant price rises.
Bitcoin Cash Poised for Breakout
The MACD for Bitcoin Cash is showing signs indicating a possible rise in price. The value of the MACD line is 4.5, and the signal line is 4.1, so the MACD line surpasses the signal line. The strong divergence marks an increase in bullish momentum, indicating that BCH is being traded more favorably by buyers. The histogram is also positive, confirming that the trend remains bullish. If the MACD remains positive, BCH is expected to keep going up and could soon experience a breakout.
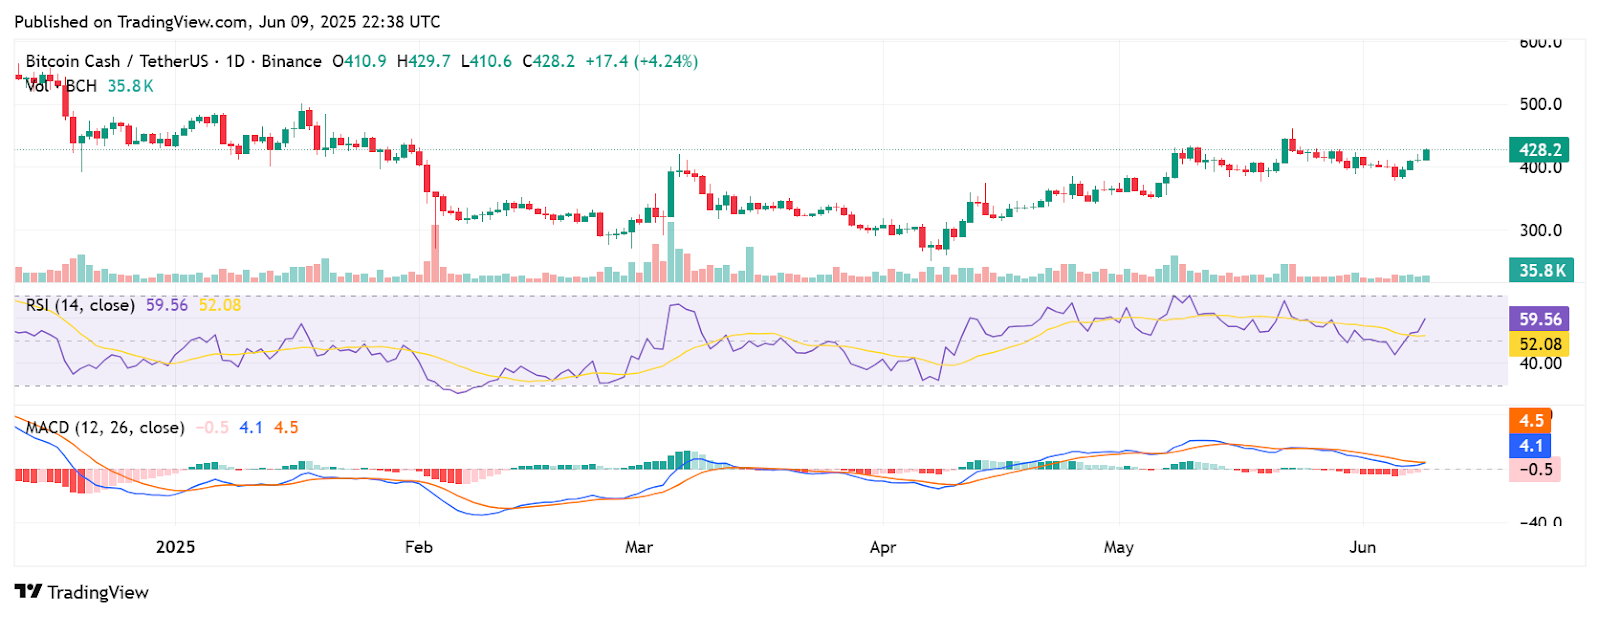
Having a strong RSI with MACD divergence indicates BCH could break through the resistance and lead to an increase in price. Investors and traders are interested in a potential breakout, hoping to achieve prices above $700 and $1,000. The current reading from the chart indicates that Bitcoin Cash may trend strongly upwards soon.
Related Reading: Solana Price Prediction: Strong Breakout Signals $164 Upside Target Soon