
Bitcoin (BTC) is maintaining a strong support above a critical support zone, reinforcing its ongoing bullish market structure. On-chain signals and technical structures are signaling increasing buyer optimism, providing a foundation for the upward continuation.
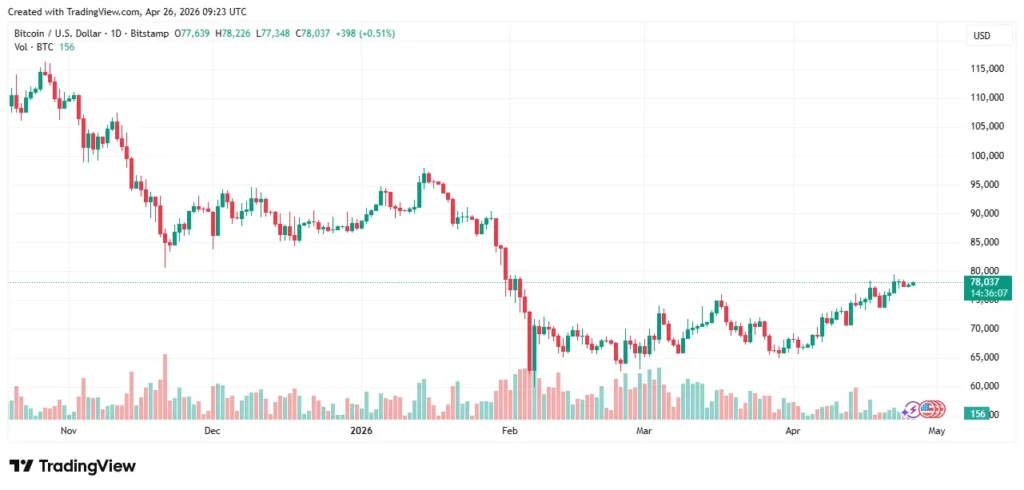
BTC is experiencing stable performance despite the fact that it is trading above a vital on-chain support zone, thus confirming its bullish structure. Currently, the BTC is trading at $78,037 after posting a modest daily gain of 0.52%. Its daily trading volume stands at $21.20 billion, while market capitalization has increased to $1.56 trillion, dominance is currently near 60.12%.
Also Read | Polygon Price Analysis Signals Breakout as POL Price Holds Key Support
Bitcoin Holds $73,700 Critical Support
As mentioned by crypto analyst Ali Martinez, Bitcoin has been able to reclaim its -0.5 MVRV support level that is currently standing at $73,700. This means that it can continue advancing towards its statistical average price of $96,000 as long as it maintains support above this level.

The MVRV (Market Value to Realized Value) model is widely used to identify whether Bitcoin is overvalued or undervalued. Holding above the -0.5 band often signals a strong recovery phase, suggesting that buyers are stepping in with confidence at current levels. This reinforces the idea that the market is building a foundation for a larger upward move.
Bitcoin Rally Targets $84,353 If Momentum Continues
From a technical perspective, it is evident that Bitcoin has made a shift from its former downward structure to an upward one. Bitcoin has broken out of its earlier downward pattern and is now forming higher highs and higher lows, suggesting that buyers have begun to dominate the market. It also shows that demand zones remain strong, thus supporting its bullish trend.

Despite being in a favorable technical structure, Bitcoin faces some resistance levels that may cause it to consolidate temporarily. Technical analysts argue that it may face some challenges in the short run due to resistance near $76,405-$77,331. Such a retracement may offer a more favorable entry point for market participants looking to align with the trend.
As long as the price remains supported above its current position, it has the potential to advance further in its journey towards the next resistance level at $79,366. Breaking past this resistance might take it toward its next price target at $84,353.
On the contrary, failure to support above this level may trigger another downward trend that may see Bitcoin move toward its realized price of $55,000.
This article contains market analysis and price predictions. These are not guarantees. Crypto markets are volatile. Always DYOR. Not financial advice.
Also Read | KAVA Price Analysis Signals Rebound at Key Support as Breakout Builds