
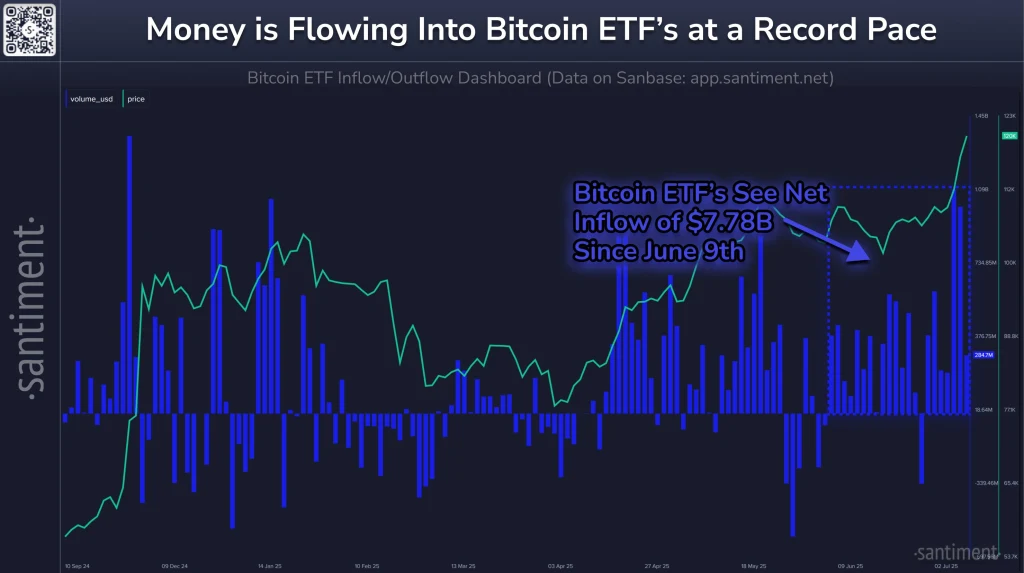
- Bitcoin ETFs have absorbed $7.78 billion in inflows since June 9, averaging $353.8 million daily.
- In spite of a minor backdown, the Bitcoin chart setup is still positive with powerful support zones.
- Historical cycle models suggest a possible all-time high peak by Q4 2025.
Bitcoin is still of interest to institutional investors, particularly when it comes to exchange-traded funds (ETFs), which are seeing healthy capital flows. Since June 9, the funds have seen a total uptake of $7.78 billion, equivalent to a daily average of $353.8 million.
This investment influx is occurring even though Bitcoin is around historic highs, validating the argument that larger players are entering the market.
Santiment data reflects the continued accumulation of major holders. This is a trend that indicates long-term holders are still optimistic, even with short-term price movements. These flows have contributed significantly to propelling BTC to new price regions, and many perceive that to be a fundamental reason behind the current strength.
Also Read: Bitcoin Dominates 43% of Crypto Chatter After $123,000 Spike, What’s Next?
Technical Signals Remain Strong Despite Pullback
The current price of BTC stands at $117,211.25, which is a minor 0.66% decline on the day chart. This was after hitting a recent high of $118,131. Yet, despite today’s red candle, the bigger picture trend remains positive. The price has regularly established higher highs and higher lows since early April, a clear indication of strength.
The daily chart reveals that BTC remains significantly above its major exponential moving averages (EMAs). EMA(20) is at $112,688, EMA(50) at $108,456, EMA(100) at $103,780, and EMA(200) at $97,274. They are all stacked together in a positive sequence, validating healthy momentum, along with clear support levels below the current level.

The momentum indicators are still positive as well. MACD is positive, with the MACD line substantially above that of the signal line. However, the lines are beginning to flatten, which means upward momentum could ease a little. Meanwhile, the RSI is 65.86, still above center but not quite overheated. This leaves a bit of latitude for further upside if buying resumes.
Bitcoin Historical Patterns Point Toward Major Peak in 2025
A market cycle model from Boris presents Bitcoin’s past post-halving action via a 360-degree radar chart. It breaks each of the halving cycles into eight 45-degree sections. Previous all-time highs frequently came in the 45° to 90° area, the current location of Bitcoin.
With this model, Bitcoin may be at or near the top for this cycle, which would occur most likely in Q4 2025. If we repeat the past, this could be the last push of the current rally before a bigger correction takes place. As long as the big picture is preserved, we can be on high alert for signs of exhaustion.
Also Read: Bitcoin Sees Decline Amid Market Shift, $115K Support May Trigger Rally