
Bitcoin price nears significant technical areas on the emergence of CME gaps and diminishing momentum. According to a cryptocurrency analyst, Bitcoin might test CME gaps in proximity and then head towards lower support levels in the coming sessions. The RSI and MACD remain bearish against strong resistance.
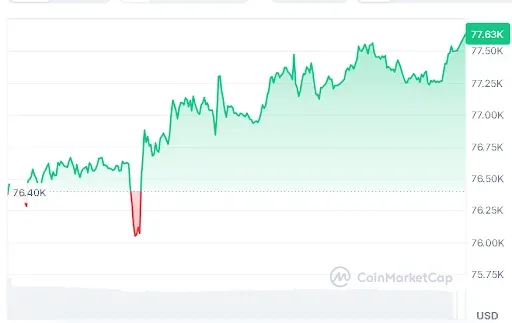
At the time of writing, BTC is trading at $77,634 with a 24-hour trading volume of $71.70 billion and a market capitalization of $1.56 trillion. The Bitcoin price has increased by 1.51% over the last 24 hours, but the overall trend remains uncertain as buyers struggle to regain full control of the market.
Source: CoinMarketCap
Also Read | Ethereum Foundation’s Unstoppable 2026 Plan: Vitalik to Sell Less ETH
Bitcoin Price Faces CME Gap Pressure
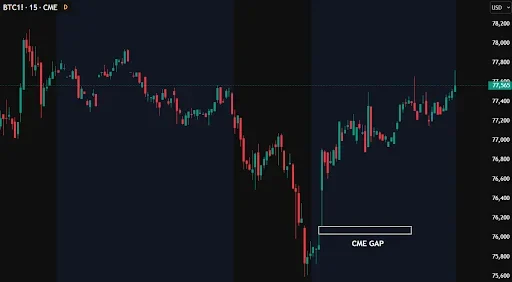
A well-known crypto analyst, Ted, observed, that BTC has created a new CME gap in the price level of $76,000. Furthermore, according to Ted, there are two more CME gaps above the current price at levels of $79,200 and $84,100. However, there is also one CME gap below the current price at $67,200.
Source: Ted’s X Post
According to Ted, the first action that Bitcoin can take is attempting to fill the gaps in the vicinity of the CME before moving further down to the lower gap. This is due to the fact that the Bitcoin price level has revisited many of the CME gaps in its movement.
Bitcoin Struggles Near Major Resistance
The price of Bitcoin seems to be struggling to make any significant bullish moves as the technical indicators remain weak in the short-term outlook. The current RSI stands at 49.34, putting the BTC at a neutral position. It can be noted that the RSI fell below the critical 50 mark recently, indicating a drop in buying pressure.
With Bitcoin still trading around the $77,634, investors will be observing how the RSI performs to return above the neutral zone. A better momentum move by the Bitcoin price would assist it in testing resistance levels going forward.

Source: TradingView
However, even MACD shows a bearish bias in the BTC/USD pair’s price action. MACD line sits at -179.48 and stays below the signal line at 235.92. While the downtrend in the negative histogram bars seems to slow down, there is selling sentiment prevailing in the market.
Additionally, the Bitcoin price is also trading below critical moving averages like the 100-day Simple Moving Average ($78,855) and 200-day Simple Moving Average ($80,413). Trading below such key levels is indicative of the continued bearish pressure on the Bitcoin price before any meaningful recovery.
For the time being, the price action of Bitcoin remains bullish by keeping above the immediate support levels and making attempts at reaching open gaps on the CME.
This article contains market analysis and price predictions. These are not guarantees. Crypto markets are volatile. Always DYOR. Not financial advice.
Also Read | American Bitcoin Corp Adds 200 BTC, Boosting Corporate Treasury Holdings
