- Bitcoin’s long-term holder ratio surges, hinting at an imminent price breakout.
- Supply squeeze underway as short-term traders exit and long-term conviction grows.
- Analyst Merlijn says $120,00 is likely if the historical pattern holds once again.
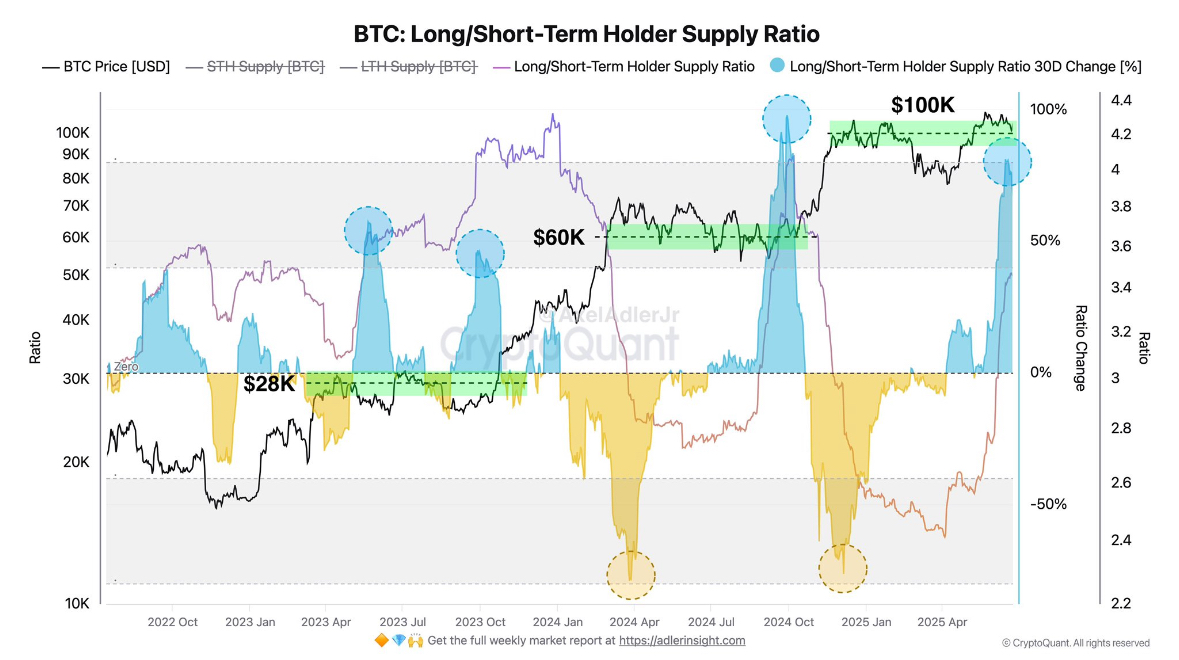
Bitcoin (BTC) could be headed for $120,000, according to a new chart shared by trader Merlijn. The chart, from CryptoQuant, tracks the Long/Short-Term Holder Supply Ratio. This metric compares coins held by long-term investors with those held by short-term traders.
Bitcoin Supply Shift Signals Another Breakout
In the past, sharp rises in this ratio have preceded major Bitcoin breakouts. The same signal was seen before the rallies to $28,000, $60,000, and $100,000.
Source: X
Also Read | Trump’s Strategic Bitcoin Bet Sparks $2.3 Billion Crypto Treasury Frenzy
Each time, long-term holders showed strong conviction, while short-term holders sold off or disappeared. The chart highlights that this same pattern is now happening again.
When that happens, supply drops. The ratio has surged, and the 30-day change is also positive. This means long-term holders are increasing, and short-term traders are shrinking fast.
This shift in supply dynamics has, since 2022, preceded every major price rally. Bitcoin’s current price sits just below $110,000, but the chart suggests that a new rally may already be underway.
If the historical trend continues, a jump to $120,000 could be next. The $120,000 level is not just speculation, it reflects a pattern seen repeatedly when this ratio spikes.
Recurring Signal Points to Imminent Parabolic BTC Move
This kind of investor behavior tends to happen when markets expect long-term gains. It means those buying now are in no rush to sell. Traders call this a supply squeeze.
If fewer coins are available on the market, buyers must pay more to purchase the coin. Merlijn noted that this exact setup has happened multiple times since 2022.
Each time, Bitcoin broke out. He hinted that this cycle might end the same way, producing with a parabolic move. The chart also shows earlier lows in 2023 and 2024, when the ratio was negative.
Those times saw price stagnation and corrections. Now, the shift back to positive territory suggests the market is heating up again.
This signal is hard to ignore since Bitcoin has followed this pattern reliably in the last three years. If that trend continues, $120,000 is a potential next stop.
In Merlijn’s words, “We’ve seen this movie before. The ending? Parabolic.”
Also Read | Bitcoin’s $114,000 Surge: Could This Be the Start of Altcoin Season?