
- Bitcoin’s MVRV rebounds off 365-day average, signaling bullish momentum remains intact.
- MVRV above 365-day average suggests Bitcoin’s uptrend is likely to hold, say analysts.
- Traders eye $106,734 support and $110,630 resistance as Bitcoin charts its next move.
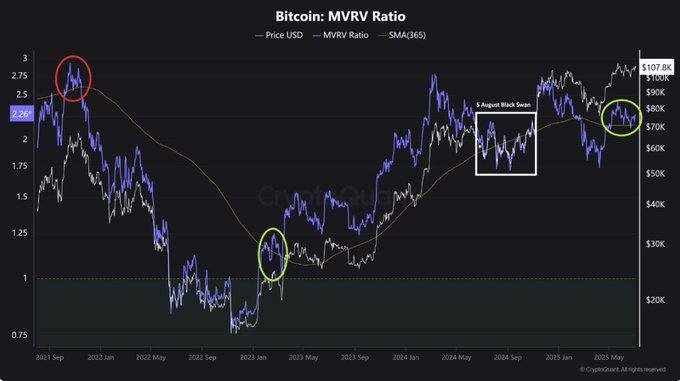
The momentum in the Bitcoin market is on the positive side, leading to the bounce off that MVRV (Market value to realized value) ratio has experienced the 365-day simple moving average. This move was emphasized by CryptoQuant, one of the most popular blockchain analysis platforms. The rebound of the MVR above this important level has only been made 12 days ago.
In the past, this average has been a solid medium-term support level for Bitcoin. This indicator is also closely followed by analysts since it is in most cases, indicates an uptrend. The exploding data indicates that there is still a bullish trend of Bitcoin, and nothing indicates that it will reverse in the near future.
Source: X
Bitcoin’s Uptrend and Investor Sentiment
The MVRV ratio is a popular indicator used by traders. It relays the present market on Bitcoin to the historical average price at which coins were last traded. A trend where the MVRV remains higher than its value in the prior 365 days tends to indicate that the market is in a healthy uptrend.
During these times, it seems that investors prefer to keep their coins in order to make a settlement. This straightforward correlation has earned the MVRV the status of a common tool among those monitoring the price trend of Bitcoin.
Also Read: Bitcoin Bull Run: Accumulation and U.S. Policy Point to $162,000 Target
CryptoQuant analysts have highlighted that not always following the tendency may be a simple task. The bull trend exists as long as the MVRV has surpassed the 365-day moving average. This will eliminate the use of complex models. It creates a clear signal to traders in a market that is not always predictable.
BTC’s Critical Price Points
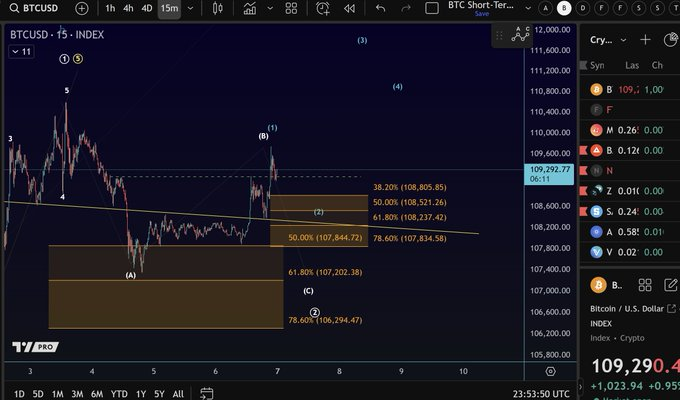
According to analyst More Crypto Online, if BTC does not break below its current levels at $107,734, the recent low on the weekend might hold. This would establish a potential five-wave uptrend. They warn, however, that the pattern looks to be a diagonal, which is potentially limiting its strength.
Source: X
A clean breach of $110,630 would spell the definite control of the bulls, reaffirming the bullish entry and triggering new long positions. Until a daily candle can close above that resistance, traders will be on edge, waiting to ride the breakout, but with a fake-out possibility in mind, since BTC is residing within choppy waters.
If price overturns and drops below $107,834, the market would most likely provoke a correction wave to the next main floor at $106,290. This level serves as the last support, which many traders observe as a possibility of rebound; its loss might just provide an opening towards a greater retrace. As the scope narrows, order books will pile up around these price magnets, causing short-term volatility.
Also Read: U.S. Spot Bitcoin ETFs Surge: $1 Billion Inflows Signal Renewed Investor Confidence