
- BNB broke out of a bullish pennant near $605, signaling a potential upward continuation.
- Analyst projects targets up to $930–$1,000 if momentum sustains above the $620 resistance.
- Key resistances are $606, $610, $620, while $592 and $580 remain crucial downside supports.
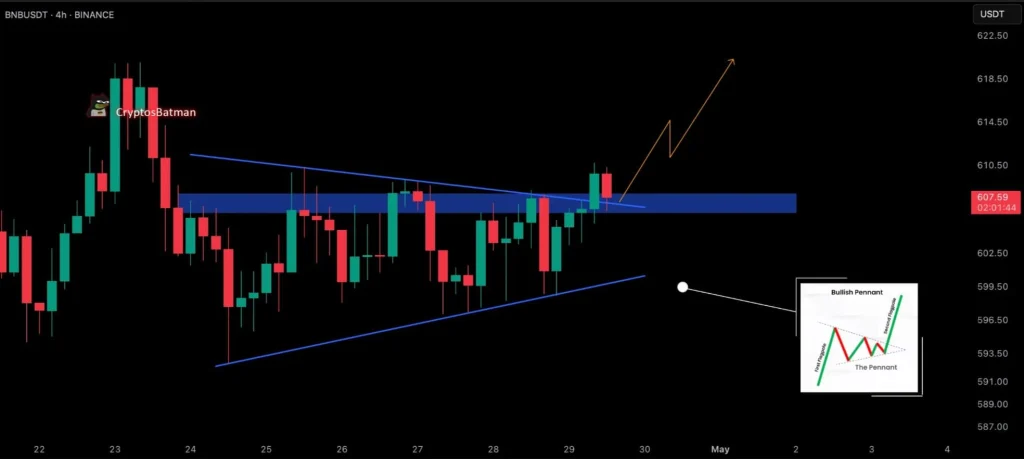
Binance Coin (BNB) surged beyond a key technical pattern on April 29, breaking out of a bullish pennant that had been forming over the past week. The breakout on the 4-hour chart signals what could be the beginning of a broader upward trend. Crypto analyst Batman highlighted the development by stating, “$BNB is breaking out of its bullish pennant, and it’s a beauty.”
The pennant took shape around April 24, as price movement slowed down and consolidated after a sharp rise. The formation was marked by converging trendlines that eventually squeezed the price into a tighter range. Once the breakout occurred, the price closed above the upper resistance trendline and a horizontal resistance zone near $605, a level that had previously capped gains.
Following this move, the same zone is now being retested as a support level. “Retesting the previous trendline and resistance like clockwork. What a clean setup!,” added Batman.
The setup is widely viewed as a classic continuation signal in trading, suggesting that the trend may not only continue but also strengthen. As shown on the chart, the analyst expects a zigzag upward move toward the $620–$625 range.
BNB Shows Signs of Sustained Momentum
On the broader 2-day chart, analysts from World of Charts also spotted the bullish pennant. They noted that it emerged following BNB’s early 2024 rally and had been forming steadily since December 2024.
Their view aligned with Batman’s, suggesting that if the coin breaks through the $620 resistance line with conviction, a new leg up could be triggered. Based on this technical reading, the upside target could stretch to $930, representing a potential 47.85% increase from the breakout. A continued surge might even push the coin to touch the $1,000 mark in the coming weeks if current momentum persists.

Presently, BNB is hovering near $603 and sitting close to the 100-hourly simple moving average. Immediate resistance lies at $606, which also aligns with the 61.8% Fibonacci retracement of the pullback from the $611 high to the $598 low. Should BNB clear $610 cleanly, the doors may open for a push toward $620.
Levels That Could Make or Break
If bulls manage to close above $620, the coin might rally further to $635, with room to test $650 shortly after. That scenario depends on sustained buying and a supportive broader market. Any consistent gains above $620 will be watched closely by traders aiming for near-term profits.
Yet the possibility of a pullback remains. If the price fails to break above $610, it might retrace again. Initial support would be expected near $600, while a deeper drop could retest $598. Stronger support, however, is found at $592. Should this level give way, the price might fall further toward $585. Additional selling could push the BNB down to $580.

Technical signals are currently balanced but lean bullish. The MACD on the hourly chart for BNB/USD is picking up momentum in positive territory, while the RSI is sitting at 50 — a neutral zone that can swing either way depending on market direction.
Read More | XRP Price Forecast: Analysts Call Cycle Top for Ripple – It’s Lower Than You Might Think