Key Takeaways:
- Cardano’s price is testing a major demand zone after a sustained downtrend, signaling early strength.
- A breakout above the resistance line could trigger a sharp upward trend if confirmed.
- ADA’s long-term supply dynamics also draw attention in contrast to Bitcoin’s issuance timeline.
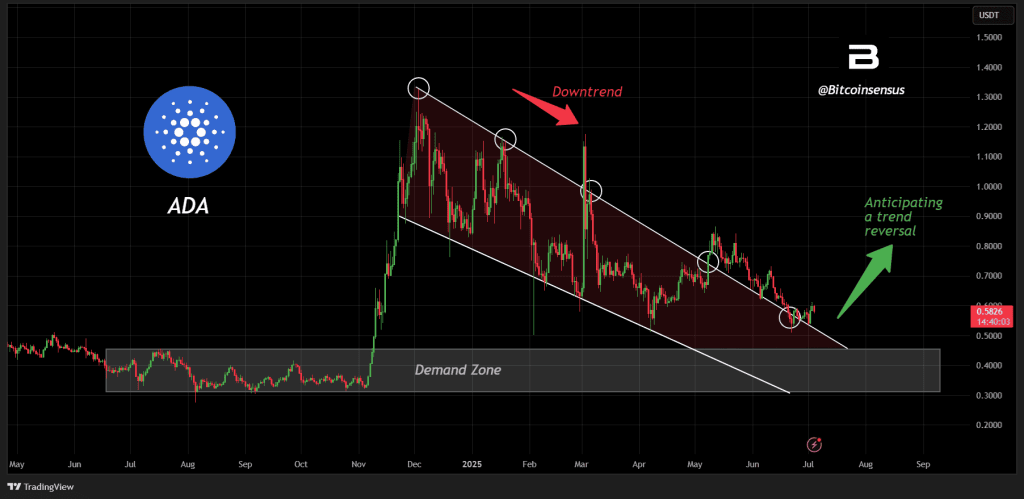
Cardano (ADA) has entered a crucial juncture as price action begins to show signs of a potential trend reversal. Based on the weekly analysis by Bitcoinsensus, ADA has been adhering respectably to a clean descending channel, dating back to early 2024.
The altcoin is now fluctuating around a vital demand region, roughly from $0.55 to $0.60, indicating the establishment of a base for the potential breakout towards higher regions.
The present weekly chart reveals that the price has rebounded from this support line while developing a bullish divergence, usually viewed as an indication of an impending trend reversal in the near future.
This divergence, likely occurring on key indicators such as the Relative Strength Index (RSI) or MACD, shows price making lower lows while momentum metrics begin forming higher lows.
The line of descending resistance, now positioned around the $0.80 to $1.00 area, is the ceiling of the pattern shown here. Should ADA break out of this higher boundary, it would seal the conclusion of the long bearish trend.
Also Read: Cardano Price Analysis: Will ADA Rebound Toward $1.00 Soon?
Chart Patterns and Price Targets Point Toward $1.20
The price configuration for the weekly chart is still technically clean. A clear parallel channel outlines the movements of ADA, with the price action always respecting the upper and lower trend lines.
Bitcoinsensus’ chart features annotations including a red arrow labeled “Downtrend,” a green arrow labeled “Reversal,” and text overlays marking the demand zone and key breakout level.
Current price of ADA is $0.57 as of July 2025 and has registered 3% growth in the past week. General data from TradingView registers 4.55% growth in the past week and 46.15% growth in the past year.
In the event ADA breaks out of the resistance band, past price action indicates the potential push towards $1.20, where past rejection levels reside.
Nonetheless, a neutral technical outlook continues. As CentralCharts indicates a long-term bullish tendency with adaptive moving averages, short-term trends remain bearish.
Long-Term Supply Metrics Set Cardano Apart from Bitcoin
The long-term implications of ADA’s issuance create another dimension of context. As tweeted by The DApp Analyst, Cardano is predicted to achieve its supply maximum by the year 2100, roughly 40 years prior to the time Bitcoin achieves its ceiling in 2140.
By 2040, close to 91–93% of the ADA supply (approximately 41–42 billion tokens) will be in circulation, and Bitcoin will have released roughly 20.85 million coins, or 99%, of its own supply.
This earlier finalization of ADA issuance could have the potential to affect its price’s behavior in the subsequent decades. Unlike Bitcoin, whose five additional halvings will occur before the year 2040, the issuance of ADA is likely to peak earlier and thus result in smoother long-term tokenomics and similarly affect investors.
Also Read: Cardano (ADA) Bounces Back 9%: July 2025 Prediction Points to 21% Gains