- Whale Activity Fuels Cardano Growth as 30 Million Tokens Are Accumulated in 24 Hours
- Bullish Pennant Pattern Suggests Potential ADA Breakout Targeting $1.74 Soon
- Cardano Derivatives Volume Surges 50%, Indicating Rising Market Interest
Cardano (ADA) has recently sparked interest in the cryptocurrency market, with analysts noting a potential price rally above $1.7. Ali Martinez reports that whales have bought an additional 30 million ADA in the last 24 hours, signaling growing institutional interest.
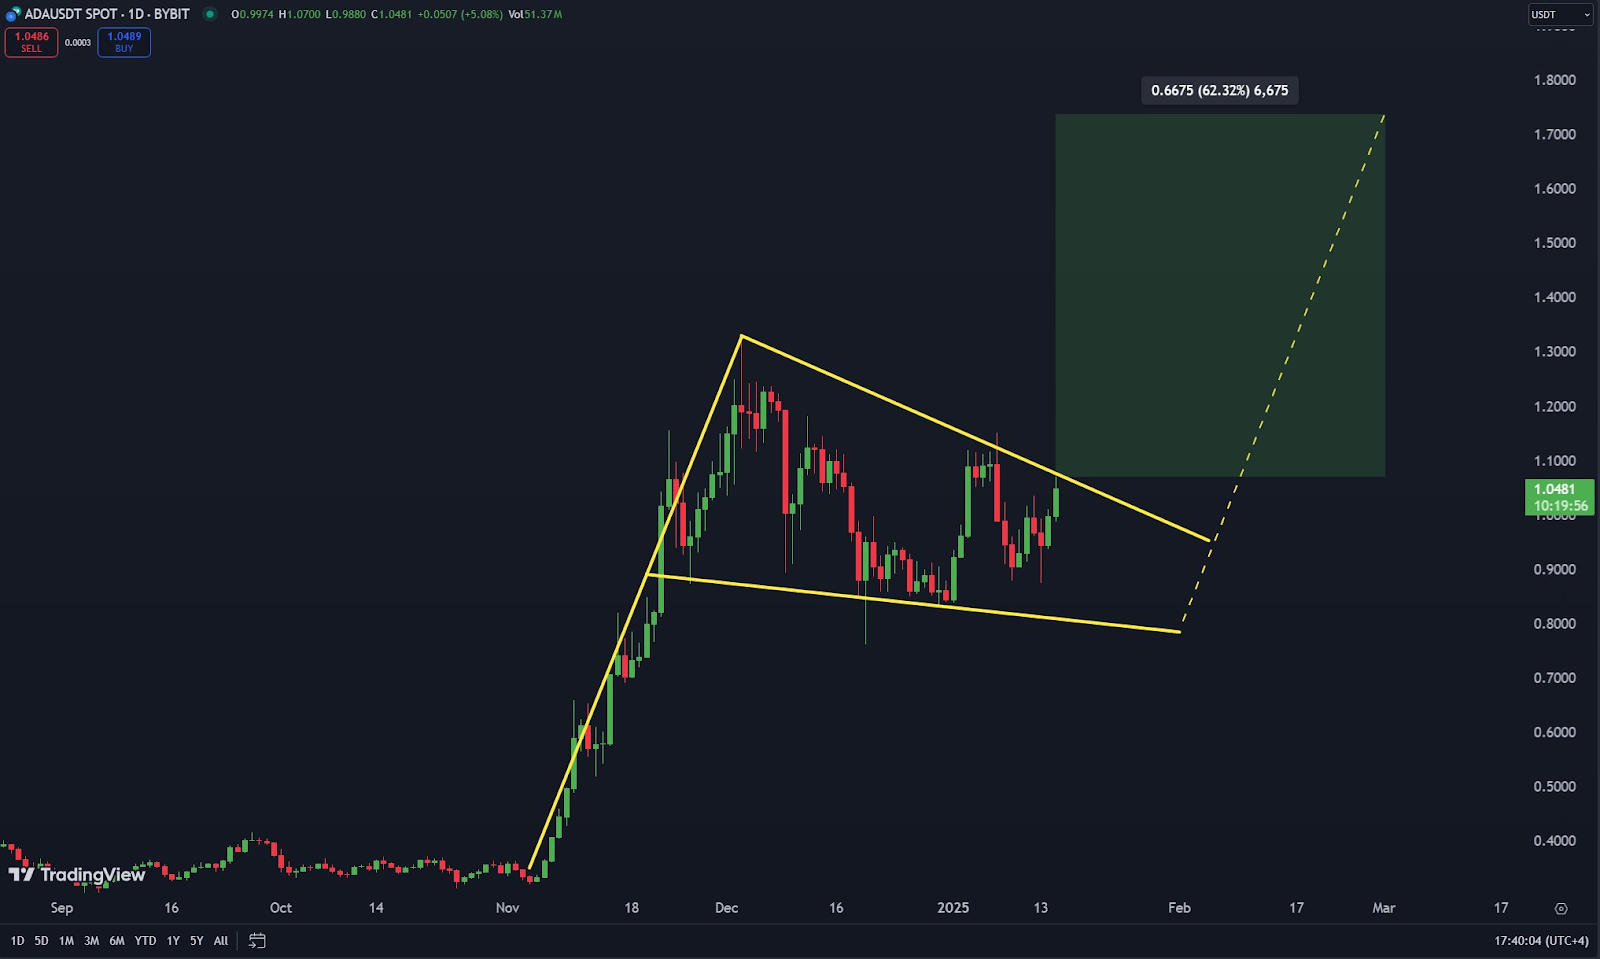
The latest analysis by crypto analyst TheMoonCarl highlights a bullish setup for Cardano, particularly in the context of its price chart. ADA is currently trading within a bullish pennant pattern, which could lead to a significant breakout and drive its price upward. The breakout could push ADA towards a target price of $1.74.
Bullish Pennant Pattern Suggests Potential Breakout
A bullish pennant pattern is forming on the daily chart of ADA. This pattern occurs after a sharp upward movement, followed by a period of consolidation. It suggests that the price may soon experience another upward surge.
Source: X
If ADA breaks above the resistance line of the pennant, it could confirm the bullish momentum. As the upper resistance and lower support lines converge, a breakout is expected soon.
Analysts believe that this could lead ADA to test the $1.74 price level. Such a move would represent a significant gain from its current price of $1.03, where it is currently down by 1.06% in the last 24 hours.
Derivatives Market Activity and Trading Volume Surge
Recent Coiglass data from the derivatives market reveals significant trading activity around ADA. The total trading volume for Cardano derivatives has surged by 50.15%, reaching $2.81 billion. This increase indicates heightened interest from traders and suggests potential volatility in the near future.
Moreover, open interest has risen slightly by 0.19%, bringing the total to $1.26 billion. This modest increase shows that while traders are actively participating, there hasn’t been a large influx of new positions.
However, the options market has experienced a sharp decline, with a 92.94% drop in options volume. This signals that traders may be focusing more on futures contracts than on options.
Market Sentiment and Liquidation Data
Market sentiment is further illustrated by the long/short ratio, which stands at 0.9327, showing a relatively balanced market. However, it slightly favors short positions. Liquidation data also provides insights into market dynamics.
Over the past 24 hours, a significant $4.45 million in positions were liquidated, with $2.71 million coming from long positions. This indicates that some traders are being forced out of their positions as ADA’s price consolidates.
Technical Indicators Signal Bullish Momentum
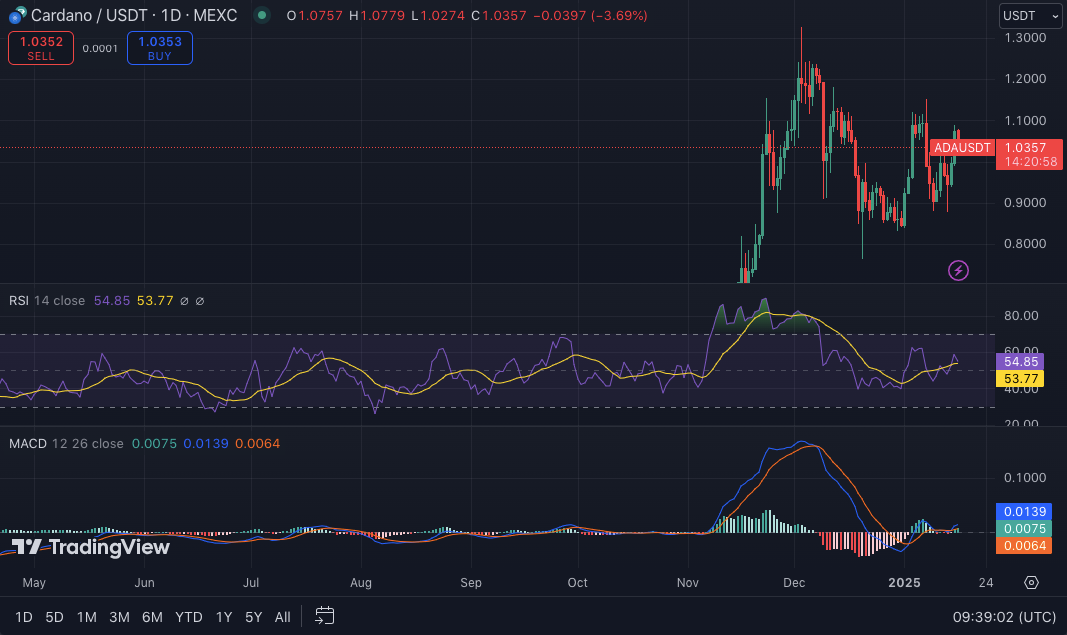
ADA/USD daily price chart, Source: Trading view
Technical indicators suggest that ADA is in a bullish zone. The Relative Strength Index (RSI) is currently at 62.90, signaling that the cryptocurrency is not yet overbought. A level above 70 could indicate overbought conditions, which might lead to a pullback.
The Moving Average Convergence Divergence (MACD) is also showing bullish momentum, with the MACD line slightly above the signal line. Additionally, the histogram has turned positive, suggesting that the uptrend could continue if the momentum strengthens.