
Celestia (TIA) price action is compressing under a key resistance level, indicating a potential breakout setup as momentum gradually builds. Improving momentum indicators and expanding volatility suggest a possible bullish reversal if a breakout is confirmed. While derivative data point to a cautious outlook. According to CoinMarketCap, as of Saturday, May 9, the TIA price is standing at $0.4390 with signs of stability over the last 24 hours.

Source: CoinMarketCap
TIA Derivative Data Point to Cautious Optimism
According to Coinglass, the TIA open interest fell by 0.38%, settling at $72.35 million, reflecting a slight reduction in outstanding derivative positions, which may indicate modest position closing or decreased market commitment among traders, signaling subdued speculative engagement.

Source: Coinglass
Trading volume decreased by 26.30%, reaching a total of $157.76 million, indicating reduced market activity compared to the previous period, with fewer transactions occurring overall, suggesting lower participation or liquidity in the asset.
Also Read: Celestia (TIA) Breaks Key Resistance as Price Targets a Breakout to $0.70
TIA Price Setup Points to a 300–400% Rally
Furthermore, the crypto analyst ZAYK charts highlighted that TIA looks poised to make an important technical breakaway from its current range following several weeks of consolidation, where the TIA price has been compressed below a strong resistance level.
The formation of such a pattern can suggest a buildup of momentum since sellers and buyers have come into balance.

Source: ZAYK Charts’ X Post
In the event that the TIA price breakout is successfully confirmed by a high volume, there will be expectations of a bullish move with the target range above $2.50.
The move may indicate a 300% to 400% increase compared to the current price levels. Confirmation is crucial here, as breakouts can sometimes fail and quickly reverse direction instead of continuing the trend.
TIA Technical Outlook Points to Bullish Reversal
According to CoinMarketCap, there seems to be an observable change in the TIA price, where it has moved from a steady bear trend to a new bull trend phase.
From falling below $0.60 and establishing itself on solid support at $0.30, the current position has gone up significantly to $0.44061.
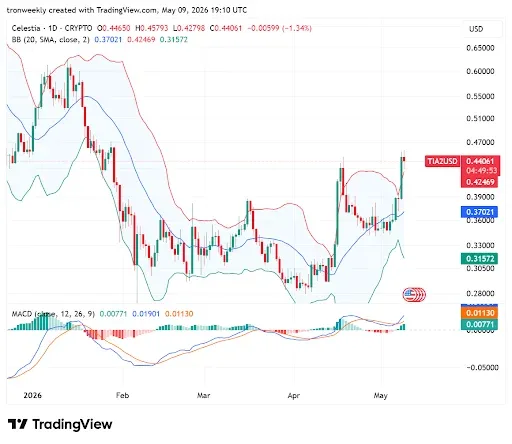
Source: TradingView
The technical indicators also serve to reinforce the change in sentiment in the market. The MACD shows the formation of a bullish crossover with increasing green histogram bars, indicating that the uptrend is gaining pace.
At the same time, the expansion of the Bollinger Bands points to the termination of the earlier low volatility environment, indicating the beginning of a new trend for the TIA price.
This article contains market analysis and price predictions. These are not guarantees. Crypto markets are volatile. Always DYOR. Not financial advice.
Also Read: Celestia (TIA) Price Trend Suggests Gradual Reversal Toward $0.40 Breakout