
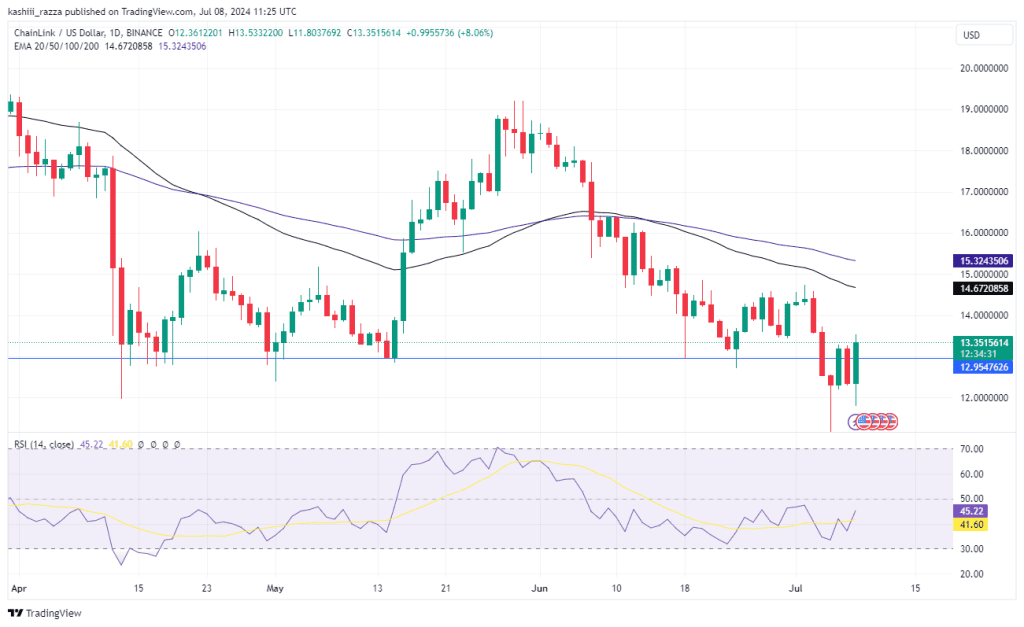
In the midst of the current cryptocurrency market upswing after a recent correction, altcoins are grappling with pivotal thresholds. Against this backdrop, Chainlink (LINK) is currently undergoing a correction, having seen an over 8% decline since the beginning of the month, dropping from $14.67 to $13.45. The price is now approaching significant support levels.
According to CryptoYapper, a prominent crypto analyst, Chainlink is positioned near a crucial support level around $12.95. This particular price point has historically served as a significant juncture, often acting as a launchpad for price recoveries and a barrier against further downturns.

The chart, shared by CryptoYapper, spans from October 2021 to July 2024, showcasing a dramatic rise and fall in Chainlink’s price. After peaking above $34 in November 2021, Chainlink entered a prolonged bearish phase, leading to a steady decline. The price found some stability around the $12 mark, which acted as a strong support zone. However, the recent downturn has brought the price back to this critical level.
Chainlink Shows Bullish Signals
As of the latest data, Chainlink is trading at $13.35, exhibiting a notable 4% gain in the last 24 hours, with trading activity surging 52%. Furthermore, the 50-day Exponential Moving Average (EMA) and the 100-day EMA are positioned above the current price, at $14.67 and $15.32, respectively, indicating potential resistance levels that LINK may encounter if the upward momentum continues.
Historically, the price crossing above these EMAs often signifies a bullish trend, but with the current position of these indicators, LINK will need to break through these levels to confirm a sustained upward trajectory. The Relative Strength Index (RSI) is currently at 45.22, moving upward from a recent low of around 41.60. While this indicates LINK is still in the bearish zone, its recent upward trend suggests a potential shift towards bullish sentiment.
The MACD (Moving Average Convergence Divergence) showcases a crossover event where the MACD line intersects the signal line from below, indicating a potential bullish reversal. This positive divergence is often a precursor to upward momentum in price, suggesting that LINK could see further gains if the trend sustains.
Meanwhile, the Awesome Oscillator (AO) histogram bars have transitioned from red to green, signaling a shift from bearish to bullish momentum. The recent green bars suggest increasing buying pressure and potentially continuing the upward trend. Overall, the combined signals provide a bullish outlook for LINK, hinting at a possible rally if the positive momentum persists.
CryptoYapper stated that maintaining this support level is crucial for Chainlink. If the price fails to hold above $12.95, it could trigger further bearish action, potentially pushing the price to new lows. Breaking below this point might lead to a loss of confidence and increased selling pressure, exacerbating the downward trend.
If Chainlink maintains its position above this level, it might indicate a potential reversal or at least a temporary pause in the downward trend. This support level could serve as a springboard for a recovery, attracting buyers who perceive this price as a bargain.
Related Readings | Solana Correction Nears Completion: Analyst Recommends DCA Strategy