• Skip to primary navigation
  • Skip to main content
  • Skip to primary sidebar
  • Skip to footer
  • About TronWeekly
  • Write for us
  • Terms and Conditions
  • Privacy Policy
  • Disclaimer
  • Contact
  • All Posts
  • Advertise

TronWeekly

Crypto World News

  • Home
  • Latest News
  • Opinion
    • Education
    • Best TRON Wallets
    • Beginner’s guide to TRON
    • Tron Tokens
    • Market Analysis
  • Industry
    • Tron Exchange
    • Project Review
  • Press Release
  • Bitcoin (BTC)
  • Ripple (XRP)
  • Advertise
  • About TronWeekly
    • The Team
    • Editorial Policy
    • Write for us
    • Privacy Policy
    • Disclaimer
    • Terms and Conditions
    • Contact
You are here: Home / Cryptocurrency News / Chainlink (LINK) Defends Long-Term Base As Bulls Eye $50–$60 Zone

Chainlink (LINK) Defends Long-Term Base As Bulls Eye $50–$60 Zone

What to know:

  • LINK is holding the lower boundary of a multi-year symmetrical triangle on the 2-week chart.
  • Traders like Butterfly and Alex Choi see signs of accumulation near long-term support.
  • A confirmed breakout could open the path toward the $45–$60 upside zone.

By Usman Zafar | Edited By Ammar Raza,February 15, 2026, 4:30 PM

Chainlink

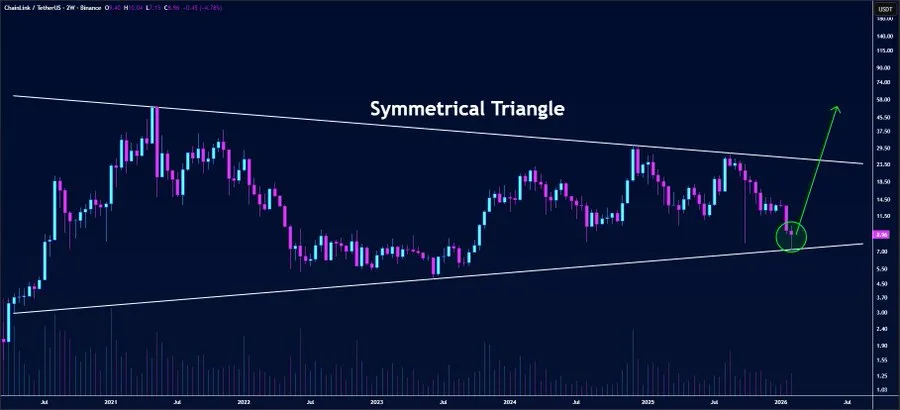
Chainlink (LINK) is once again drawing attention as price action reacts strongly near a major support zone on the 2-week chart. On Feb 14, crypto analyst, Butterfly shared that LINK is bouncing from the lower boundary of a large symmetrical triangle formation.

This level has acted as a base for buyers multiple times in past years, and the market response suggests accumulation may be underway again.

This type of triangle formation began building after the peak of the LINK price in the bull cycle of 2021. Since the top was established, the price began a long consolidation phase. This is characterized by a tightening price action that is leading to a well-defined pattern of lower highs and higher lows.

The upper trend line connects the major swing highs established in 2021, 2024, and 2025. The rising lower boundary connects the corrective lows established in 2022 and 2023.

This type of price action is typical of a market that is balanced and not dominated by either the bulls or the bears. Each attempt to move higher is met with selling pressure, and each test of the support levels is met with buying pressure.

Read More: Chainlink (LINK) Price Analysis: Can Bulls Defend the $8.47 Level to Trigger a Rebound?

Compression Pattern Signals Possible Expansion

Symmetrical triangles may indicate a volatility compression situation, which means that price movement becomes more compact as it approaches the apex.

It appears that Chainlink is currently in the final stage, which usually displays significant price movement. The depth analysis of the chart indicates that there is a gradual reduction in volume within the symmetrical triangle, which usually occurs during a maturing situation.
Source: X

The projection on the chart suggests that if the buyers are able to break through the descending resistance line, they could take LINK to the region of $45-$50 first.

The measured move of the triangle, considering the height of the triangle from the 2021 high to the low in 2022, also suggests that there is a possibility of a much larger move.

Butterfly had even suggested a move to as high as $60 if the bulls are in control. However, as discussed, there is a need to confirm the move. Without breaking through the resistance line, Chainlink seems to be stuck in a range.

Chainlink Breakout Confirmation Remains the Key Trigger

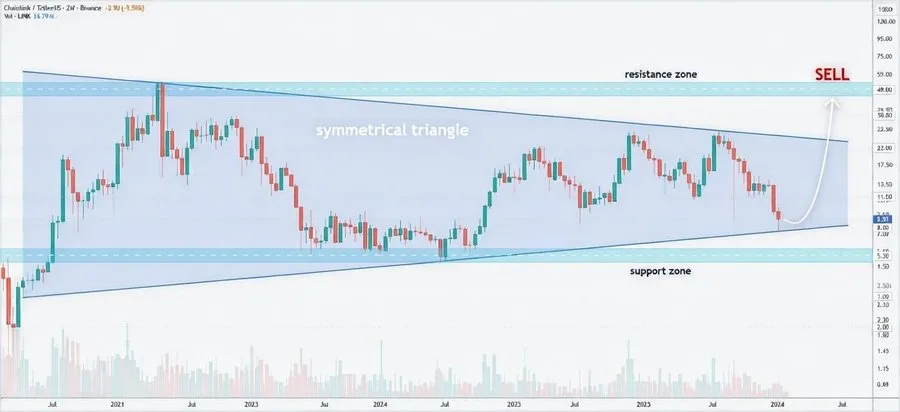
The same situation has also been analyzed by the analyst Alex Choi, who stated that the price is approaching the apex of the triangle and is located near the lower boundary. The area, according to the analyst, has a high bounce potential, as this area has always been defended by the buyers.
Source: X

The next step for the bulls would be to see a clean close above the descending trendline on a 2-week candle, and this would be a good sign that the trend is shifting upward. If the price goes below the rising support line, it would be a negative sign and would lead to a retracement zone.

Read More: Chainlink (LINK) Rallies Toward $10 as Resistance Break Sparks Bullish Momentum

Filed Under: Cryptocurrency News, Altcoin News

About Usman Zafar

Usman Zafar is a News Desk writer at Tronweekly with over five years of experience in cryptocurrency and blockchain journalism. He covers Bitcoin, Ethereum, DeFi, crypto laws and regulation, market activity, Layer 2 scaling solutions, and blockchain-based innovations, focusing on fast-moving developments and official industry updates. Usman previously wrote for BTCread and follows strict verification and editing practices to ensure accurate, timely, and responsible crypto news for a global audience.

Primary Sidebar

Recent Posts

  • DOT Price Analysis: Falling Wedge Signals Potential Breakout Toward $15.50 May 23, 2026
  • Bitcoin Price Coils for Major Move as AI Tokens Ignite Explosive Rally May 23, 2026
  • ASTER Price Moves Tight Squeeze Pattern: Is a Major Breakout Imminent? May 23, 2026
  • DOGE Price Prediction: Fake Breakdown Hints at an Explosive Rally to $1.90 May 23, 2026
  • MoonPay Launches USDH and USDC Access Through Hypercore Network May 23, 2026

Footer

News

  • Latest News
  • Altcoin News
  • Bitcoin (BTC)
  • Blockchain
  • Tron (TRX)
  • World

Digest

  • Meet the Founder
  • Price Winning Article
  • DeFi
  • Cyber Security
  • Crypto Scam

Industry

  • Project Review
  • Technology
  • Fintech
  • Tron Exchange
  • New in Town

Tron Universe

  • Event and Tron Parties
  • New in Town
  • Tron Tokens

FOLLOW US

  • Facebook
  • Telegram
  • Twitter
  • Linkedin

Editorial Policy | Privacy Policy | Disclaimer | Terms and Conditions | Masthead

Copyright © 2026 · Tron Weekly. All Rights Reserved. NOTE: Tron Weekly is an independent crypto news site that adheres to the strict journalism policy anchored on transparency, trust, and objectivity, we have no affiliation with the TRON Foundation, its founder Justin Sun or any other cryptocurrency firm.