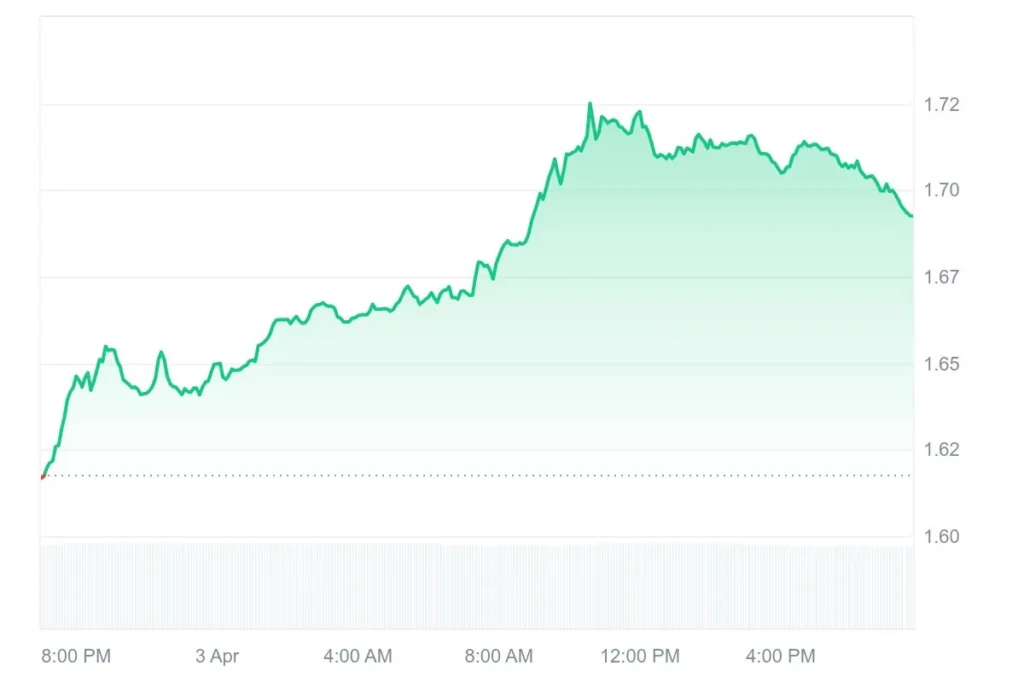
Cosmos (ATOM) is currently trading at $1.69, rising 3.26% in the latest session as price action edges toward a key technical resistance zone. Despite the upward move, 24-hour trading volume has declined 4.91% to $46.52 million, reflecting cautious participation across the market.
As of the latest trading session, the token has recorded a 1.42% weekly gain, signaling consolidation after a prolonged downtrend. While short-term momentum has improved, the lack of strong volume suggests traders remain hesitant, waiting for confirmation of a directional breakout.
Price Stabilization Signals Possible Trend Reversal
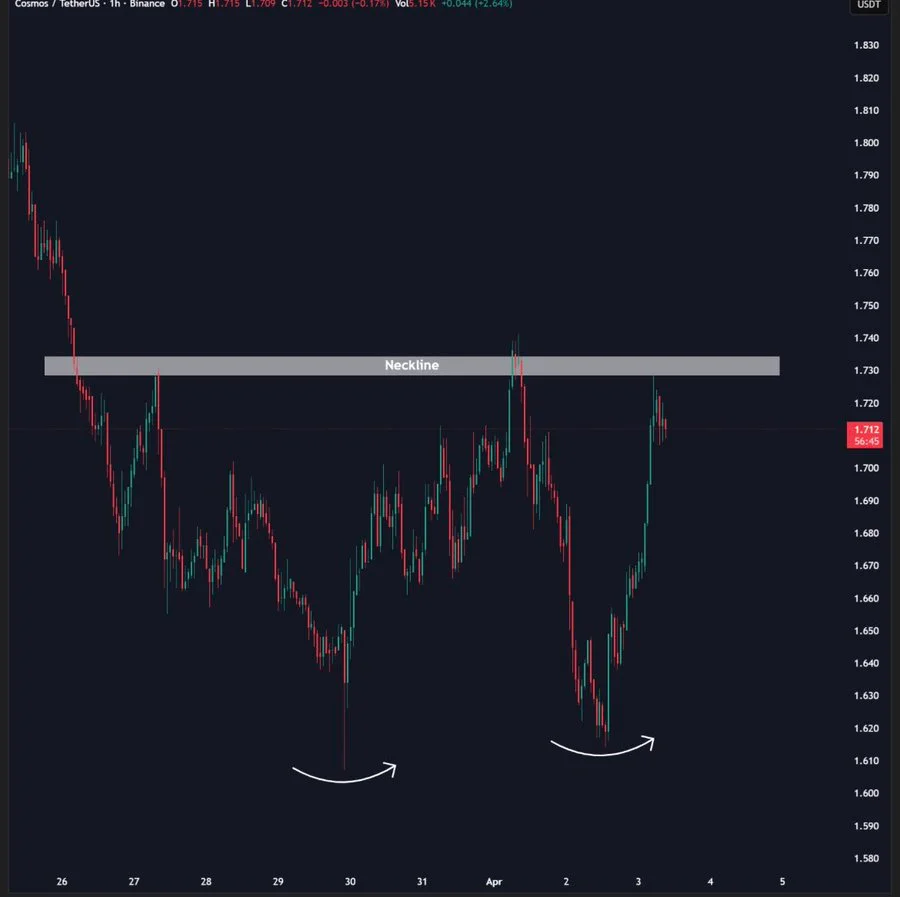
According to crypto analyst ChiefraT in a recent post on X, the token is forming a potential double bottom pattern near the $1.61–$1.62 support zone. This structure typically emerges when sellers fail to push prices lower on repeated attempts, suggesting weakening bearish momentum and early accumulation.
Earlier price action was defined by consistent lower highs and lower lows, confirming a dominant downtrend. However, the recent stabilization near support indicates that selling pressure is being absorbed by buyers.
Between the two lows, ATOM rebounded toward the $1.73 neckline resistance, a level that has repeatedly capped upside movement. The asset is now revisiting this zone with stronger bullish momentum, though confirmation remains pending.
A decisive breakout above $1.735 would validate the double bottom pattern and could shift short-term sentiment toward recovery. However, rejection at this level may result in another pullback, although higher lows would still preserve a constructive technical structure.
Also Read | Cosmos (ATOM) Signals Bullish Reversal as Resistance Levels Gain Attention
Cosmos Price Consolidates in Downtrend Channel
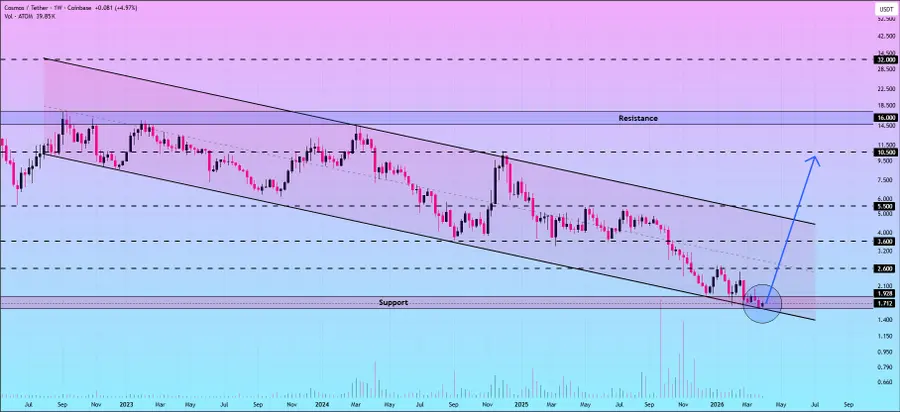
Another analyst, Profit Demon, notes that ATOM is consolidating near the lower boundary of a long-term descending channel on the weekly chart. This structure has guided a sustained bearish trend characterized by lower highs and lower lows.
The current price region between $1.7 and $2.0 aligns with both horizontal support and the channel’s lower boundary, making it a key decision zone for traders. Recent candles show reduced volatility and tighter price compression, often associated with seller exhaustion and early accumulation phases.
If buyers manage to defend this level, ATOM could stage a recovery toward intermediate resistance levels at $2.60 and $3.60. Further upside extensions include $5.50 and a long-term resistance zone near $10–$11, aligning with the upper channel boundary.
This article contains market analysis and price predictions. These are not guarantees. Crypto markets are volatile. Always DYOR. Not financial advice.
Also Read | Cosmos (ATOM) Eyes Major Rebound: Could $14.50 Be the Next Stop?