- Dogecoin jumped 22% this week, breaking out of a long consolidation phase.
- Strong signals from RSI, MACD, and EMAs show bullish momentum gaining traction.
- Price patterns mirror the 2021 setup, hinting at a possible run toward $1.
Dogecoin had a strong performance this week, climbing 22.21% to trade at $0.2416. After months of sideways movement above $0.14, the latest weekly candle formed a bullish engulfing pattern, a strong sign of a potential trend reversal.
This surge in price was backed by a spike in trading volume, which hit 269.41 million, the highest level since April this year. The sudden increase in activity suggests renewed interest from traders.
DOGE is now trading above all major exponential moving averages: the EMA 20 at $0.2007, EMA 50 at $0.2011, EMA 100 at $0.1772, and EMA 200 at $0.1446. These indicators have either flattened or started to slope upward, which usually means the downtrend is fading and a new uptrend may be starting.
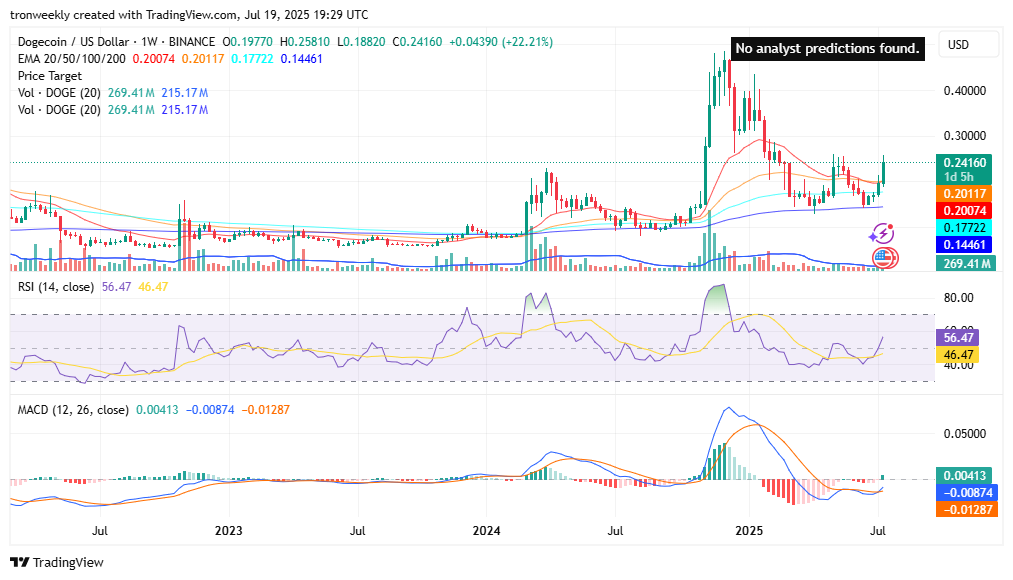
Momentum indicators also support the bullish outlook. The Relative Strength Index (RSI 14) has moved up to 56.47, crossing above the mid-level of 50. That shift shows bulls are gaining control. The MACD line is rising and closing in on a crossover, while the histogram has flipped green. That often signals that bearish pressure is weakening and upside momentum is building.
If DOGE stays above $0.24, the next major barrier is around $0.30. This was where sellers stepped in earlier this year. Clearing that level could open the door for a run toward the 2025 high of $0.42. On the flip side, strong support now sits around $0.20, backed by the EMA 20 and EMA 50.
Also Read: Dogecoin Price Prediction: DOGE Bulls Target $1 as Bit Origin Reveals $500M Treasury
Chart Structure Matches Pre-2021 Rally
A chart by Trader Tardigrade shows something interesting. It compares DOGE’s current setup with its 2020–2021 breakout pattern. Back then, DOGE formed a rounded bottom followed by a rising wedge, which ended with a huge rally to over $0.70. The current weekly chart shows a nearly identical pattern forming again: a rounded base and a rising wedge between $0.18 and $0.20.
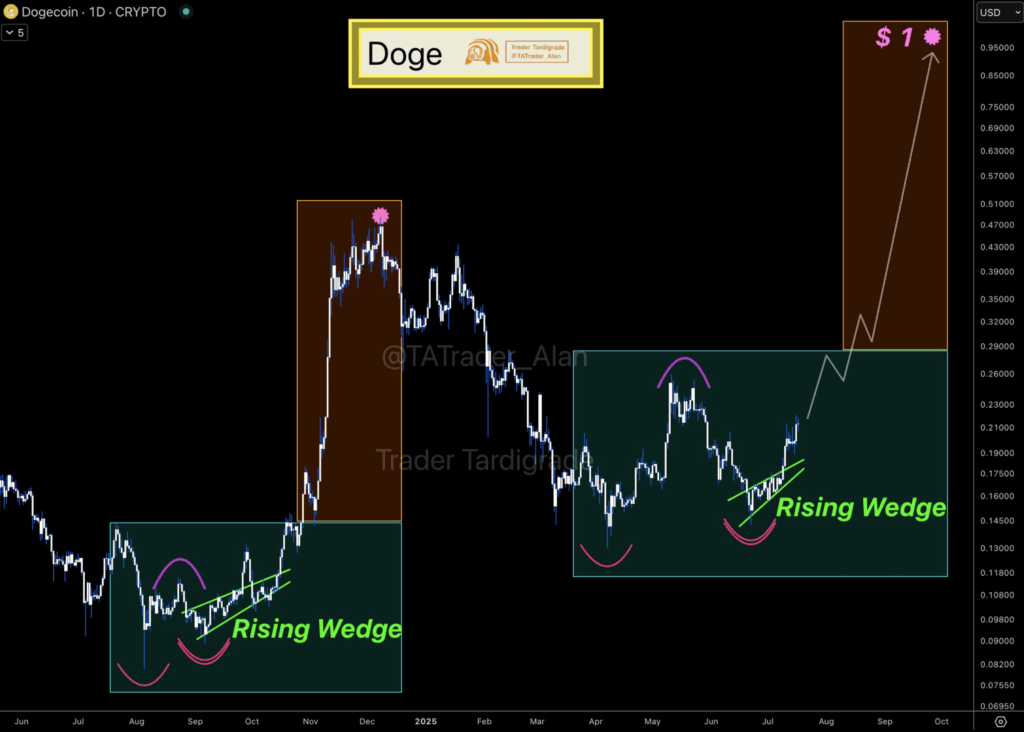
There’s also a head-and-shoulders bottom forming inside the wedge. This is often seen before a reversal to the upside. The similarity to the 2021 breakout has caught the eye of many traders who are looking for repeat setups.
Dogecoin Eyes on $1 If Pattern Plays Out
If this pattern plays out like last time, Dogecoin could be setting up for another major rally. The chart projection shows a path leading toward $1, with steady gains and minor pullbacks. The key zone to watch is between $0.22 and $0.25. A strong move above that area could confirm the breakout and trigger the next big leg up.
For now, the pieces seem to be falling into place. The volume is back, the indicators are shifting, and the price is breaking out of its range. All signs point to a potential bullish phase ahead, one that could mirror the explosive run of 2021.
Also Read: Dogecoin Breaks Out: Analysts Predict DOGE Price Surge to $3.2 by 2025