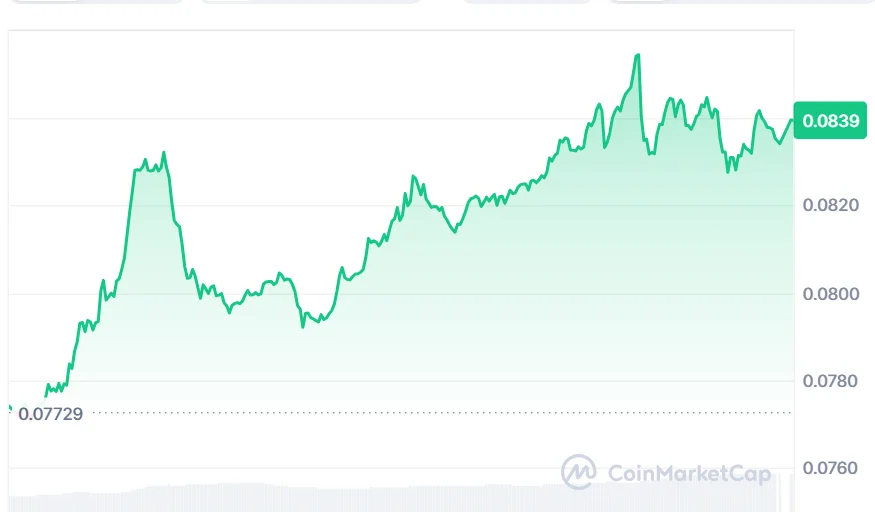
Dogecoin price has started to move upwards with great momentum following a breakout from a period of price compression, with technical indicators indicating that there is upside potential if the breakout sustains.
At the time of writing, DOGE is trading at $0.08344, while its 24-hour trading volume stands at approximately $2.89 billion. Its market capitalization is around $12.98 billion, with the cryptocurrency up 7.44% over the last 24 hours.
Dogecoin Price Moves Above the Ichimoku Cloud
In his post on Aug. 21, an analyst, Trader Tardigrade, pointed out a recent interesting development seen in DOGE’s Ichimoku four-hour chart configuration.
The explanation goes that for weeks, the Dogecoin price was seen trading below a bearish Kumo, or cloud formation, from the $0.070 price level, but is currently trading above the cloud with Tenkan-sen moving higher.
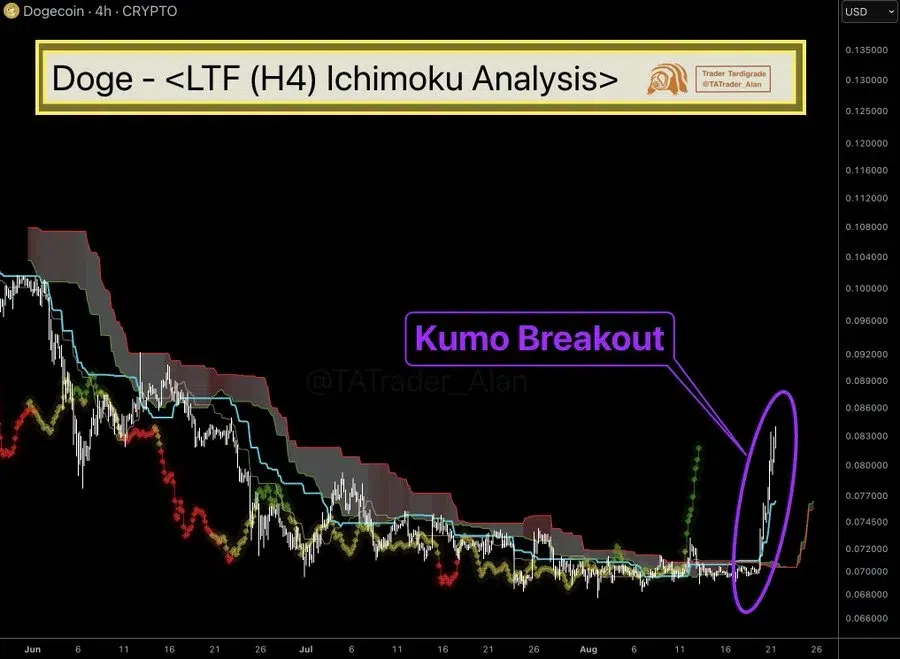
The advance Kumo is starting to form as well. Put simply, the pattern indicates a more favorable short-term price structure formation, but the breakout requires further validation.
The Tardigrade trader pinpointed the $0.077-$0.078 range as a significant level for support in case DOGE retraces. The drop closer to the $0.070-$0.072 range would make the setup less valid.
However, the good thing about it is that the $0.083-$0.086 range is the first resistance zone for the pair. For DOGE to move towards $0.089-$0.092, the cryptocurrency needs to stay above the cloud level and form support.
What should be noted here is that even though the breakout itself means nothing for further gains, its confirmation by closing above the cloud level on the four-hour chart will.
Also Read | AVAX Price Eyes $10 as Bullish Triangle Pattern Builds Momentum
Dogecoin Price Jumps Above Key Technical Level
A new technical indicator comes from the Bollinger Bands of Dogecoin.
The recent DOGE price level was higher than the upper Bollinger Band level at around $0.07868, with the middle band being at $0.07141 and the lower one at $0.06413.
Prices that move above the upper Bollinger Band usually indicate heavy buying interest in the asset. But sometimes, prices can move very fast and face a temporary correction afterward.
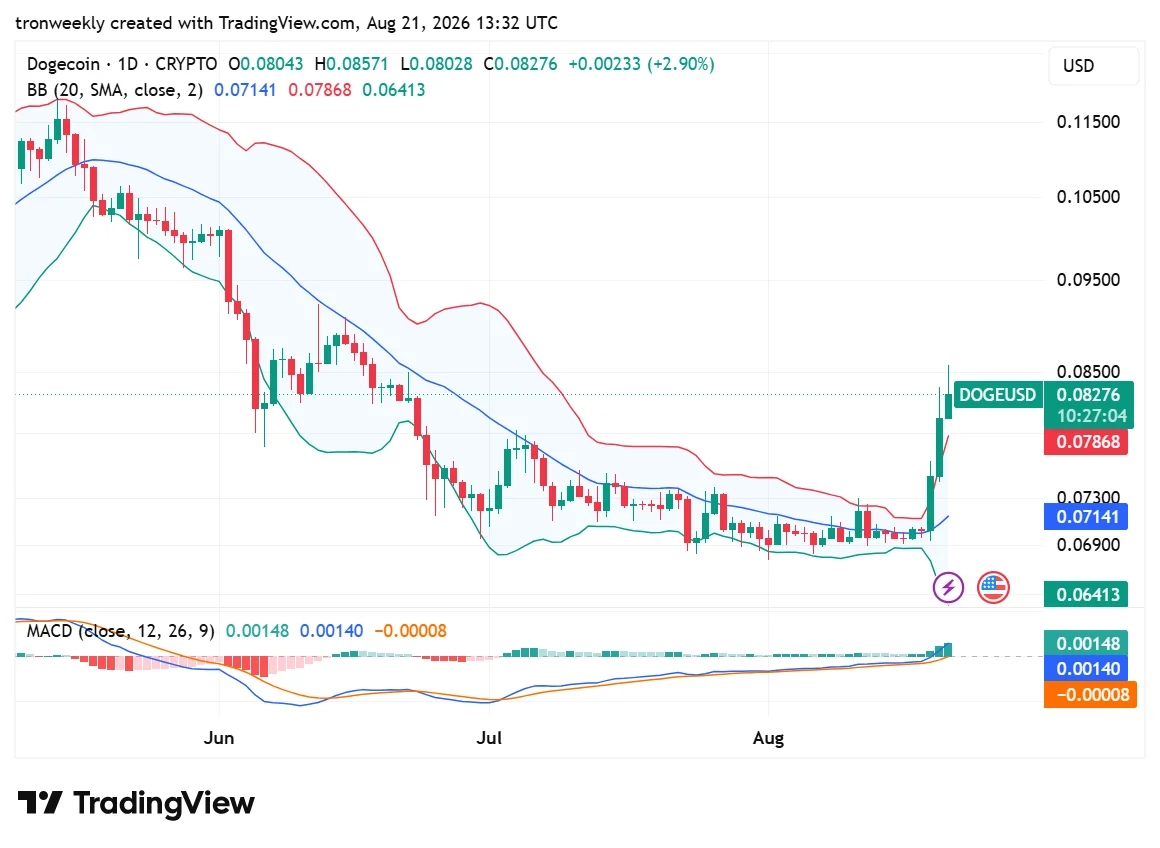
The MACD indicator is also giving added strength to the positive bias. With the current readings of 0.00148, 0.00140, and -0.00008, there is an improvement in momentum as the histogram is now positive.
All three indicators – the Ichimoku cloud, Bollinger bands, and MACD are all in line with each other. However, indicators can shift quickly in a very volatile asset like Dogecoin.
What Happens Next for Dogecoin Price?
The coming few sessions of four hours each could be crucial in establishing whether the breakout of DOGE becomes more substantial or not, following the previous rise.
The first area to watch out for will be $0.083-$0.086, with a breakout here keeping the near-term positive pattern valid, with $0.089-$0.092 being the next area in case of sustained buying interest.
The negative aspect here is the fact that $0.077-$0.078 represents the first significant test level. The lower one could be seen as $0.070-$0.072, as it might mean a return to the initial point from where the breakout took place.
For those interested in the market, the idea here is that the technical picture of Dogecoin has been significantly strengthened, but it should be confirmed. The breakout above the Ichimoku cloud and the growing momentum on the MACD side prove this.
As such, the $0.077-$0.078 support zone and the $0.083-$0.086 resistance zone will continue to be the critical levels to watch out for, but any break of the resistance level would pave the way to $0.092.
Also Read | CAKE Price Prediction: CAKE Eyes $50 as Bullish Reversal Takes Shape
This article contains market analysis and price predictions. These are not guarantees. Crypto markets are volatile. Always DYOR. Not financial advice.