
- ENA is testing the upper resistance of a descending channel, signaling a possible bullish trend reversal.
- A confirmed breakout could push the price toward key targets at $0.45, $0.63, and $0.95.
- Improving market sentiment, driven by Bitcoin’s rebound, is fueling momentum across altcoins, including ENA.
Ethena (ENA) is on the way to its bullish trend reversal and moving towards its resistance level around $0.95. It is forming a descending channel pattern, which often precedes a breakout potential. As BTC is moving above its key support level, it is also impacting the overall market, including ENA. Both traders and investors are closely watching this coin and expecting a trend reversal.
At the time of writing, ENA is trading at $0.3568 with a 24-hour trading volume of $364M and a market capitalization of $2.17B. Its price over the last 24 hours is up by 8.96%, and over the last week it is also up by 4.76% and showing high potential for the next major rally.
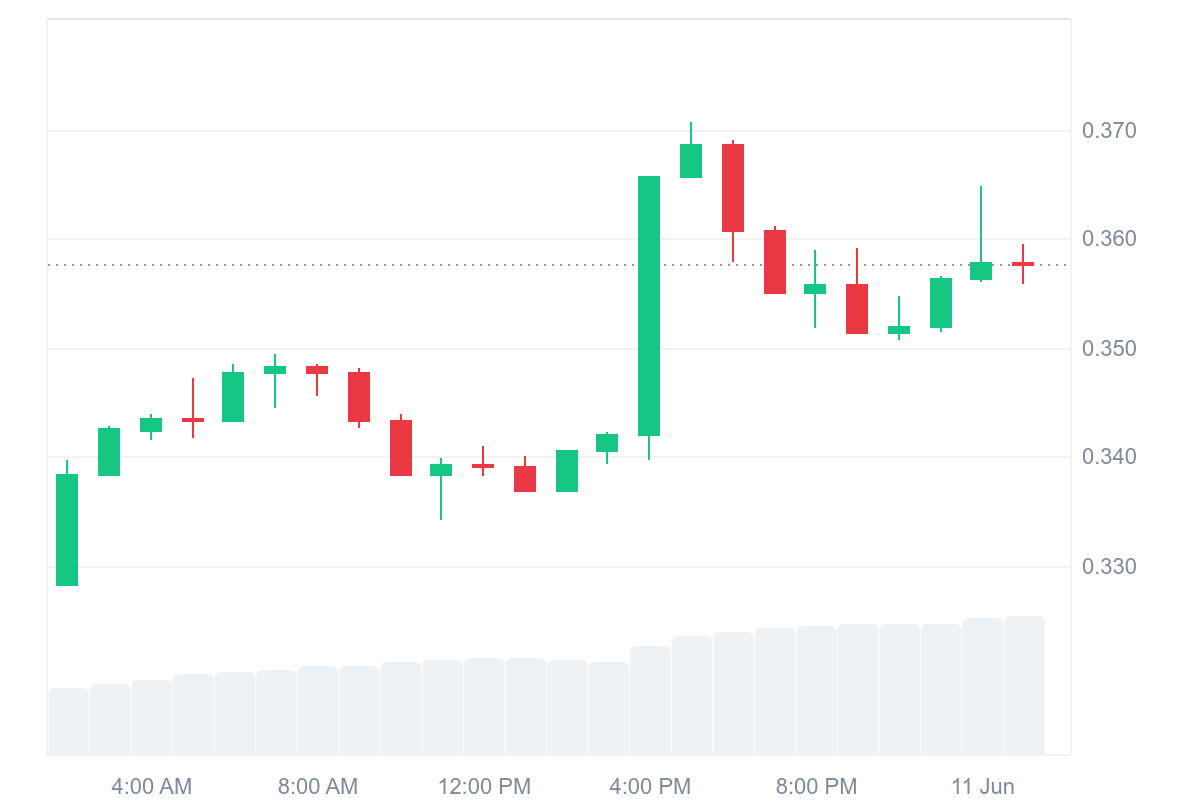
Source: CoinMarketCap
ENA Signals Bullish Breakout Toward $0.95
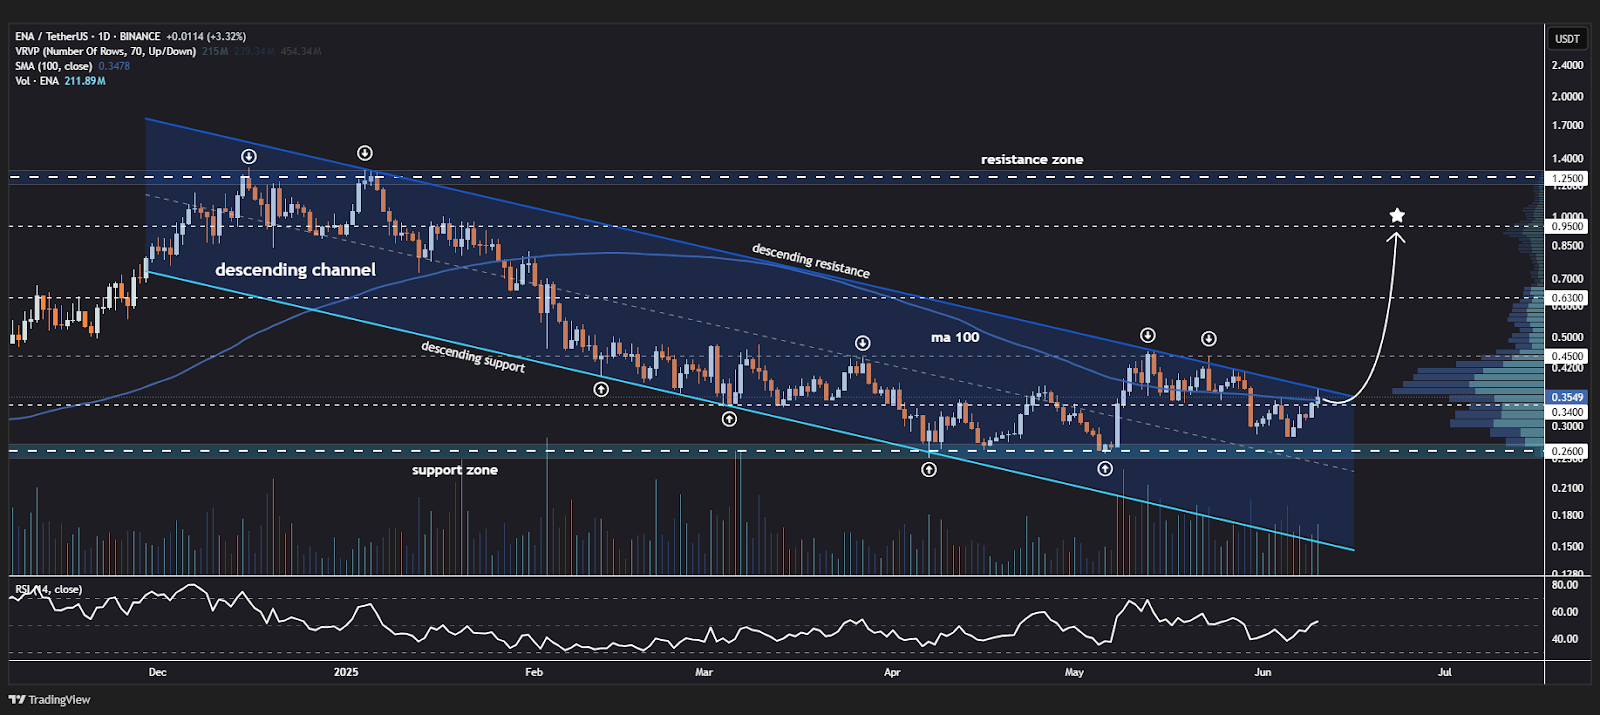
According to crypto analyst Jonathan Carter, ENA is a coin that has been attracting a lot of interest in the alternative crypto space. At present, it seems to be indicating early signs of a potential bullish breakout. According to the daily time frame, the token has been consolidating within a descending channel, which, typically, is often seen as a sign of weakening bearish pressure and a potential shift toward a bullish trend.
Currently, ENA is testing the upper resistance line of this channel, a level that has repeatedly blocked any upward movement since the beginning of its downward trend. The retest of this resistance attracts technical traders because breakouts from descending channels often result in substantial price increases, especially when they are verified by volume expansion and price action sustained above the breakout level.
Source: X
If ENA manages to escape this channel, analysts have mentioned several important upside targets. The first major resistance is situated around $0.45, which is a short-term level that coincides with a zone where support has flipped to resistance. Thereafter, additional momentum could send prices up to $0.63, another significant level seen in the Fibonacci process, and then up to $0.95, considered a psychological and structural area of resistance that may also serve as a long-term target.
With shifting sentiments from a cautious consolidation type of phase to a risk-on appetite, its chart structure is indeed compelling. Of course, in crypto, as always, confirmation is key; here, traders should wait for some solid technical signals before going long.
Related Reading: SAI Price Analysis: Breakout Pattern Targets $0.038 Bull Run