
Ethereum regained market attention this week after fresh institutional inflows and large-scale blockchain adoption strengthened long-term bullish sentiment around the asset.
Institutional market participants looked at ETFs, tokenization, and technical indicators as evidence of preparations for the next round of investments by institutions.
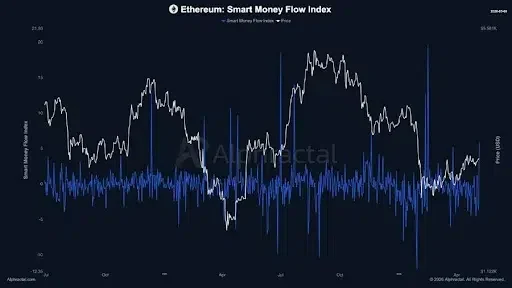
According to Alphractal, Ethereum ETF inflows reversed their outflow trend that persisted for almost five months and, in April, saw a net inflow of $356 million. ETF inflows continued on May 1st, gaining an additional $101 million.
Source: X
According to reports, BlackRock and Fidelity Investments were responsible for over 90% of the money flowing into Ethereum. It is also reported that Alphractal’s Smart Money Flow Index became positive ahead of the price rebound in Ethereum.
The shift in big player behavior takes place against a background of Ethereum trading above key support levels following a lengthy corrective move.
Also Read: Litecoin Price Eyes Strong $58 Breakout After Core Update
Ethereum ETF inflows Drive Wall Street Expansion
Meanwhile, crypto market analyst Crypto Patel highlighted some positive trends that favor the future of Ethereum. The update revealed that mainstream financial institutions are relying on Ethereum for their tokenization, custody, and investments.
Among the developments mentioned above, it is important to highlight that BlackRock sued concerning the tokenization of their money market fund on Ethereum.
It is known that JP Morgan runs the MONY Fund on Ethereum architecture, whereas Blackrock’s BUIDL fund has already grown to $2.85 billion in assets.
Such trends point towards increased Ethereum ETF inflows. Robinhood is working on setting up its Layer-2 solution, while BNY Mellon has initiated custody services for Ethereum in the United Arab Emirates.
Furthermore, DTCC has set up blockchain-enabled asset management platforms with connections to the Russell 1000 index. In addition to that, WisdomTree has launched a staked Ethereum ETP across Europe.
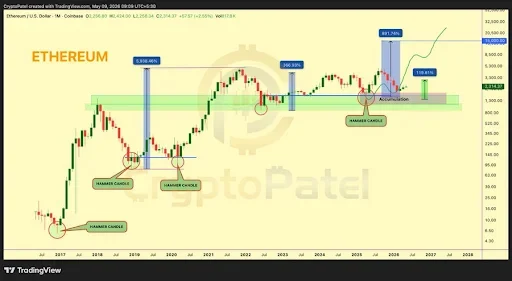
Historical Monthly Structure Repeating at Key Support Zone
Ethereum’s monthly candlesticks on the technical side show that another classic setup is forming within the critical support level around the $1,300 to $1,700 range.
Analysts analyzing the charts will note that back in 2016, 2019, and 2020, each bottomed cycle saw the formation of massive hammers before rising.
Source: X
The most recent month’s candle has remained in the same long-term accumulation zone, suggesting that buyers were able to buy out selling pressure.
The historical evidence suggests that a pattern like this often results in explosive moves higher, ranging from more than 366% to even as much as 5,900% on other occasions. Ethereum remains well above a critical historical demand zone after falling from its record high near $4,800.
This article contains market analysis and price predictions. These are not guarantees. Crypto markets are volatile. Always DYOR. Not financial advice.
Also Read: AAVE Price Outlook: Support Holds Firm as Bulls Eye $105 Target