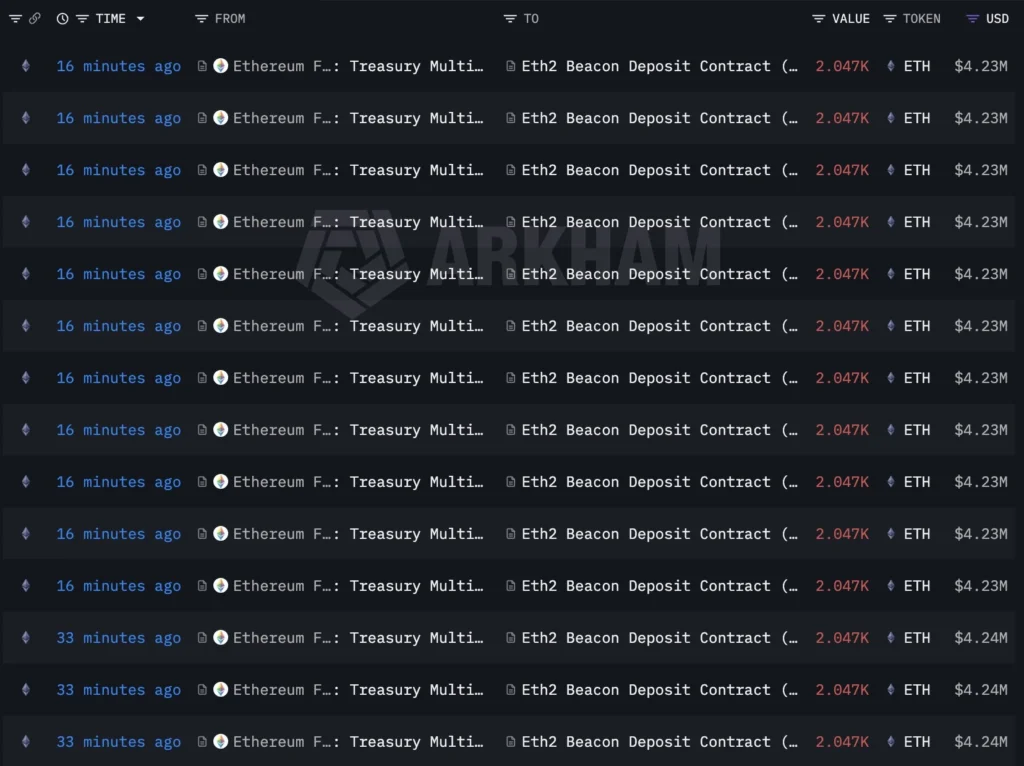
The Ethereum Foundation has reinforced its long-term commitment to the network by staking an additional 45,034 ETH on Friday, April 3, valued at roughly $93.11 million.
This move strengthens Ethereum’s proof-of-stake system, where validators secure the blockchain. By locking such a large amount, the Foundation signals strong confidence in the network’s stability, security, and continued growth trajectory.
Source: Lookonchain’s X Post
This significant staking action also reduces the circulating supply of ETH, a factor often viewed as bullish by market participants.
As Ethereum expands across DeFi, NFTs, and scaling solutions, the Foundation’s involvement highlights alignment with the ecosystem’s future, reinforcing investor sentiment and underscoring Ethereum’s evolving economic model and long-term value proposition.
Also Read: Ethereum Price Prediction: Eyes Break Above $2,500 Zone
Ethereum Price Setup Signals Potential Surge to $50K
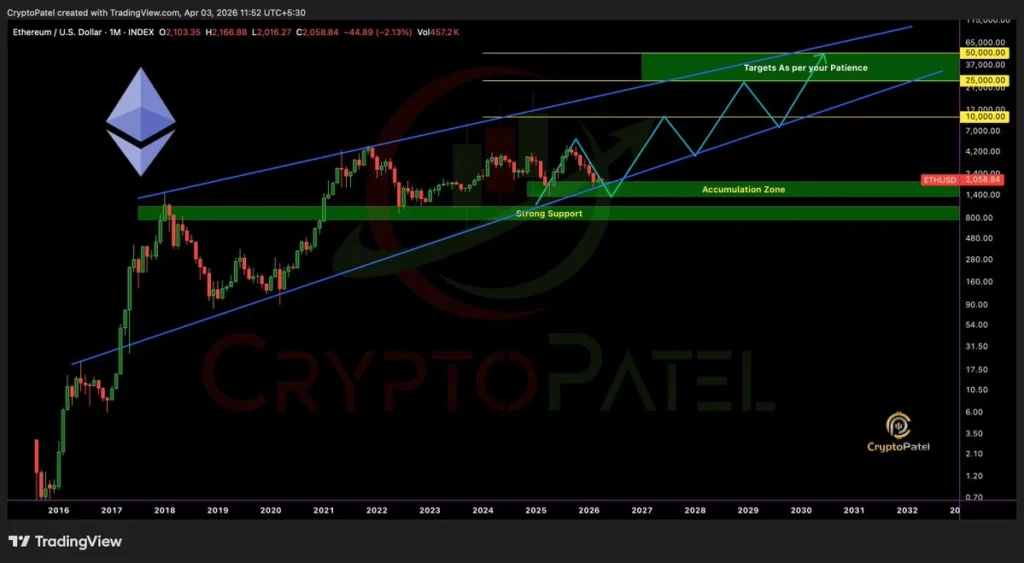
Following this staking activity, another crucial time for ETH has come. The asset is currently trading in a long-term ascending channel, which has been providing structure to the cryptocurrency’s price action since 2017.
According to crypto analyst Crypto Patel, ETH has once again come back to retest the accumulation range of $1,400 to $2,000.
Source: Crypto Patel’s X Post
Every previous contact with this trend line resulted in explosive gains, which adds to the expectation of an analogous outcome if this formation is maintained.
These targets include $10,000, $25,000, and even $50,000, and this could be seen as the basis of the next wealth cycle in the crypto space.
ETH Momentum Indicators Show Neutral Outlook
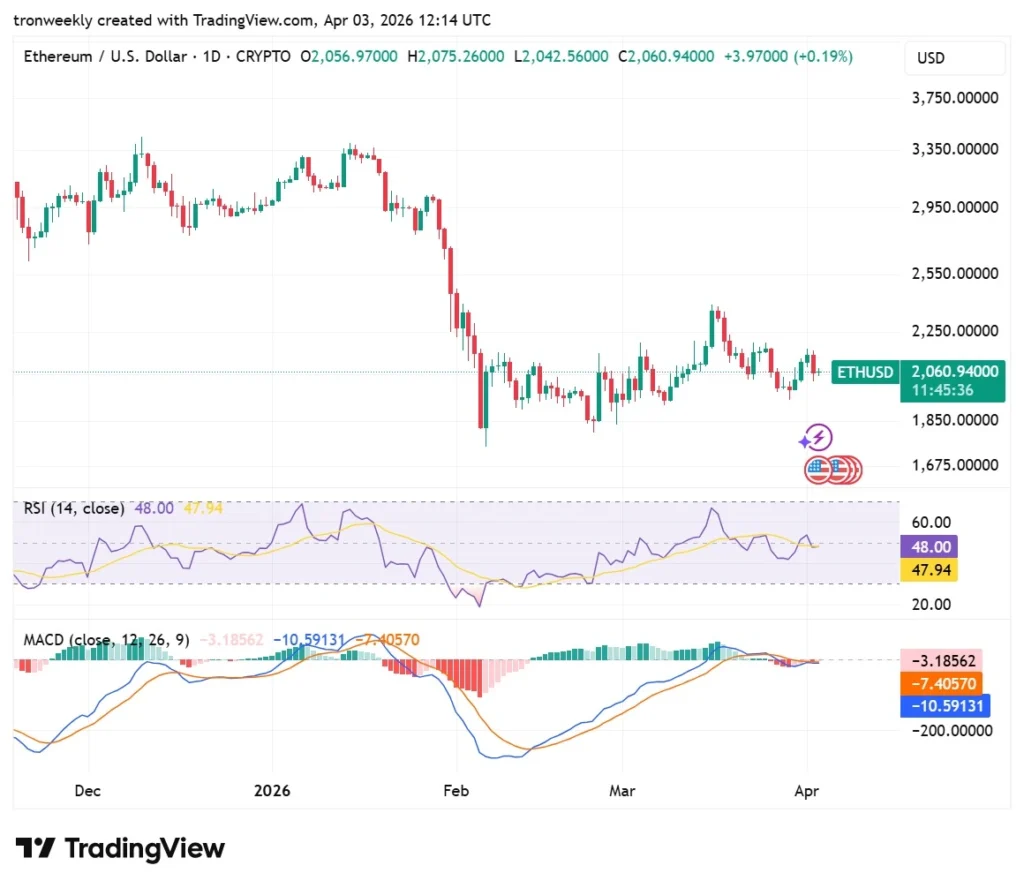
According to TradingView, the RSI stands at 48.00, indicating that Ethereum is in an outright neutral stance. It is not overbought or oversold, as the current price movement is horizontal.
The RSI line is interwoven with its signal line, meaning that there is no significant momentum from either the bulls or the bears, since both sides are struggling for dominance.
Source: TradingView
The MACD indicator demonstrates convergence between the blue and orange lines, which happen to be very close to the zero line.
The almost parallel shape of the histogram indicates the exhaustion of the power of the trend direction. In general, these indicators imply that there should be a breakout or breakdown in order to establish a trend.
This article contains market analysis and price predictions. These are not guarantees. Crypto markets are volatile. Always DYOR. Not financial advice.
Also Read: Ethereum Traders (ETH) Eye Positive Signals: Binance Sparks 2026 Breakout Surge