
Ethereum (ETH), the second-largest cryptocurrency with a market cap of $402.55 billion, is exhibiting promising signs of bullish momentum. In a recent technical analysis, Jonathan Carter highlights Ethereum’s consistent movement along a robust ascending support line over the past two years, providing a solid foundation for its upward trend despite occasional pullbacks.
The ascending support line has acted as a bedrock for Ethereum, allowing it to maintain its upward trajectory. This consistent support has enabled the cryptocurrency to withstand market fluctuations, showcasing its resilience. As Ethereum continues to move along this support line, Carter’s analysis suggests it is poised for significant price movements.
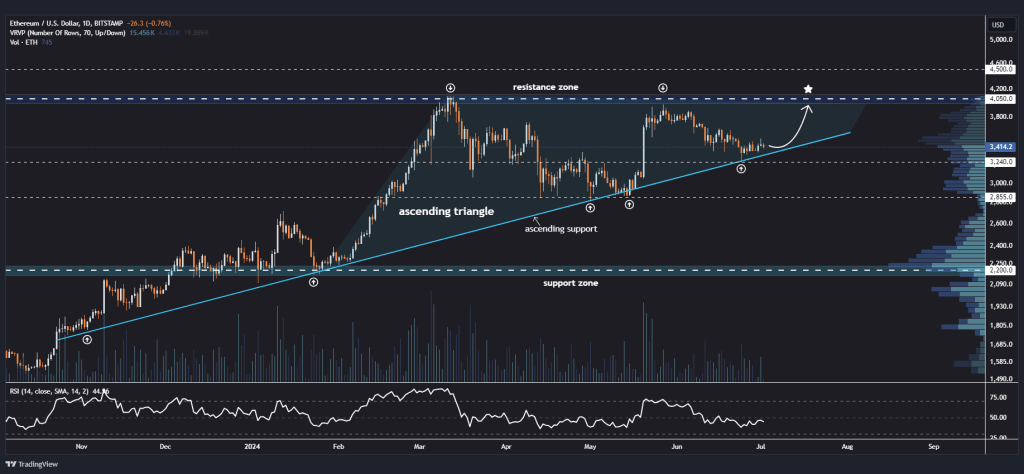
Carter reveals Ethereum is currently positioned within an ascending triangle pattern, a bullish formation often preceding substantial price increases. The resistance zone, around the $4,050 level, is a critical threshold ETH must surpass to validate a continued bullish trend. Breaking this resistance could pave the way for further gains, potentially driving Ethereum to new heights.
Ethereum’s Bullish Outlook
For traders looking at near-term gains, Carter sets a conservative target of $4,050. This target is strategically chosen to manage risk, offering a balance between potential profit and safety. However, for those willing to embrace a higher level of risk, Carter proposes a more ambitious target of $5,000, aligning with the overall bullish sentiment from the ascending triangle pattern.
In contrast, Carter identifies key support around the $2,200 level, a crucial accumulation area where strong buying interest emerges whenever it approaches this level. This support has reinforced the trend, ensuring that any downward movements are met with substantial demand, further solidifying Ethereum’s upward momentum.
Ethereum is presently experiencing sideways movement, trading at $3,348 with a 2.49% decrease in the last 24 hours. Recently, it was rejected by a descending trendline. Should Ethereum break above this descending trendline around the $3,500 level, it could rise 5.5% from the breakout point to reach its previous high of $3,717 set on June 9.
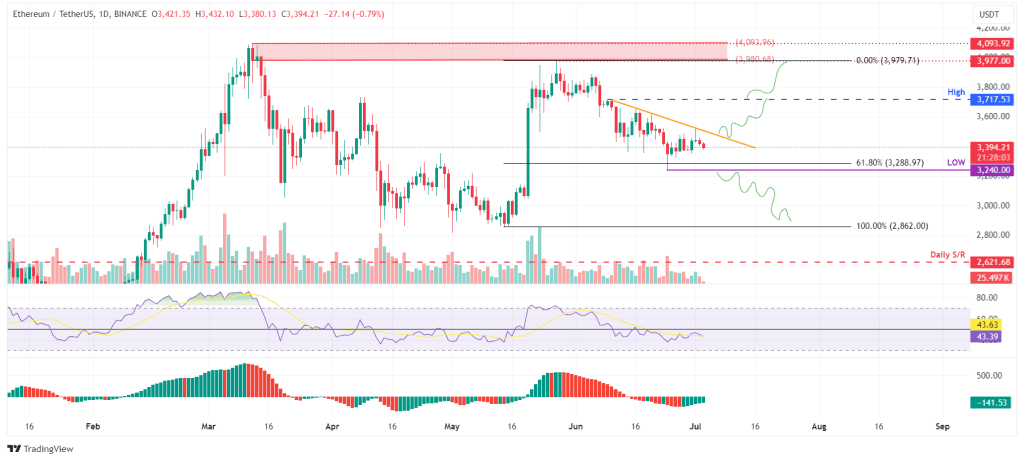
If Ethereum manages to close above the $3,717 mark, it may continue rallying by 7%, aiming to reach its previous resistance level at $3,977. The Relative Strength Index (RSI) supports this potential for upward movement, hovering around 44, indicating a neutral zone. This suggests that it has room for upward movement without the immediate risk of a sharp correction.
However, If Ethereum’s daily candlestick closes below $3,240, it would indicate a significant break in the market structure. Failing to maintain this bullish momentum might result in a 12% decline, potentially leading to a drop to the previous support level at $2,862.
Related Readings | Avalanche (AVAX) Consolidation Suggests Uptick: Expert Predicts Price Jump to $60-$65