• Skip to primary navigation
  • Skip to main content
  • Skip to primary sidebar
  • Skip to footer
  • About TronWeekly
  • Write for us
  • Terms and Conditions
  • Privacy Policy
  • Disclaimer
  • Contact
  • All Posts
  • Advertise

TronWeekly

Crypto World News

  • Home
  • Latest News
  • Opinion
    • Education
    • Best TRON Wallets
    • Beginner’s guide to TRON
    • Tron Tokens
    • Market Analysis
  • Industry
    • Tron Exchange
    • Project Review
  • Press Release
  • Bitcoin (BTC)
  • Ripple (XRP)
  • Advertise
  • About TronWeekly
    • The Team
    • Editorial Policy
    • Write for us
    • Privacy Policy
    • Disclaimer
    • Terms and Conditions
    • Contact
You are here: Home / Cryptocurrency News / Ethereum (ETH) Faces Potential Pullback as TD Sequential Sell Signal Appears

Ethereum (ETH) Faces Potential Pullback as TD Sequential Sell Signal Appears

What to know:

  • Ethereum flashed a TD Sequential sell signal on its price chart
  • The indicator suggests bullish momentum may be weakening
  • Traders are watching key support levels for a possible pullback

By Malavika Nair | Edited By Ammar Raza,March 11, 2026, 8:30 AM

Ethereum

Ethereum (ETH) may face short-term downside pressure after a TD Sequential sell signal appeared on its price chart, a technical indicator usually used by traders to identify potential trend exhaustion.

The signal has gained attention among market analysts who analyze momentum indicators to assess possible reversals in cryptocurrency price actions.

ETH has lately experienced a span of upward movement before encountering resistance near key technical levels. After this rally, the appearance of the TD Sequential indicator’s sell setup suggests that the bullish rally could be weakening in the near term.

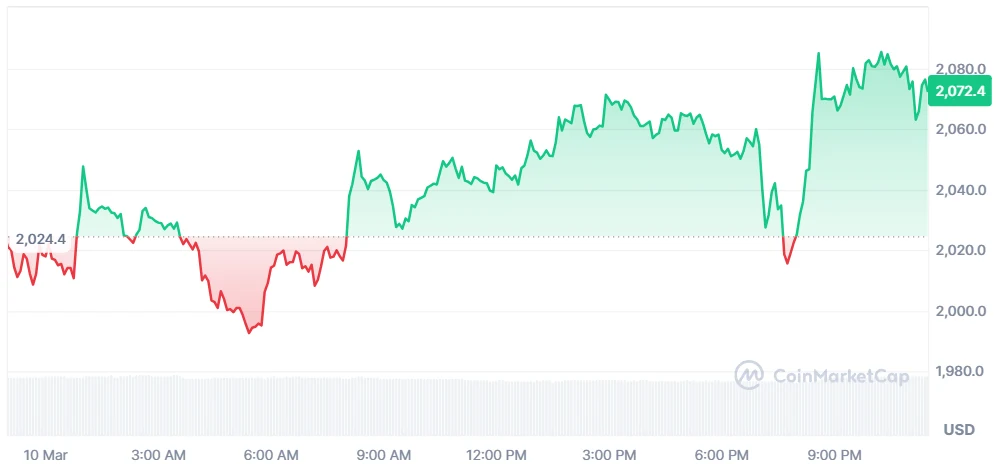
According to the data given by CoinMarketCap, at the time of writing, the coin is trading at $2,072.71 with a 2.69% increase in rate. The daily trading volume of the token is around $24.49 billion, and the market cap of the coin has exceeded $249.97 billion.

ethereum
Source: CoinMarketCap

Also Read: Ethereum (ETH) Under Pressure: Hold $1,900 or Trigger Bear Crash?

Ethereum’s TD Sequential Indicator Signals Possible Reversal

The TD Sequential indicator is a technical analysis tool made to assess potential turning points in market trends. It identifies sequences of price candles that can signal when an asset’s current trend may be nearing exhaustion.

In ETH’s case, the sell signal came after a sequence of upward price actions on the shorter-term charts. Traders often interpret this pattern as a warning that buying momentum may be slowing and that a correction or consolidation phase could follow.

While the indicator does not guarantee a price decline, it has always been used as an early signal of possible market pullbacks when combined with other technical factors.

The last two TD Sequential sell signals on Ethereum $ETH resulted in 7.79% and 11.65% corrections.

A new sell signal has now emerged.

What happens now? pic.twitter.com/Pb0nQYhIpQ

— Ali Charts (@alicharts) March 10, 2026

Key Support Levels Under Watch

As the sell signal appears, analysts are keenly observing and monitoring Ethereum’s support zones. These levels represent areas where buying interest has previously emerged and could potentially stabilize the market if downward pressure increases.

Maintaining support above these levels is significant for keeping the larger market structure. If ETH holds above key support areas, the market may transition into consolidation rather than a deeper correction.

A breakdown below these zones could lead to further declines as investors adjust their positions in response to changing momentum signals.

Also Read: Ethereum (ETH) Descending Channel Tightens with $2,400 in Focus

Filed Under: Cryptocurrency News, Ethereum (ETH)

About Malavika Nair

Malavika S is a Data Analyst at Tronweekly, providing data-driven insights into cryptocurrency markets and digital assets. Her work focuses on Bitcoin, altcoins, meme coins, and DeFi, while tracking Layer 1 and Layer 2 blockchain projects, DeFi tokens, and key technical indicators. She adds analytical context to market movements and macro trends, translating complex data into clear, reader-focused coverage. Malavika holds a Master’s degree in Communication and Media Studies.

Primary Sidebar

Recent Posts

  • CAKE Price Prediction: Bullish Structure Point to a Rally Toward $1.80 Target May 12, 2026
  • Hyperliquid ETF Filing by Grayscale Adds Staking Feature for HYPE Investors May 12, 2026
  • SHIB Price Ascending Triangle Signals Rally Toward $0.00000760 Resistance Ahead May 12, 2026
  • XRP Price Analysis: Can XRP Reclaim $1.49 Resistance? May 12, 2026
  • CLARITY Act’s 309-Page Crypto Market Overhaul May 12, 2026

Footer

News

  • Latest News
  • Altcoin News
  • Bitcoin (BTC)
  • Blockchain
  • Tron (TRX)
  • World

Digest

  • Meet the Founder
  • Price Winning Article
  • DeFi
  • Cyber Security
  • Crypto Scam

Industry

  • Project Review
  • Technology
  • Fintech
  • Tron Exchange
  • New in Town

Tron Universe

  • Event and Tron Parties
  • New in Town
  • Tron Tokens

FOLLOW US

  • Facebook
  • Telegram
  • Twitter
  • Linkedin

Subscribe US

Editorial Policy | Privacy Policy | Disclaimer | Terms and Conditions | Masthead

Copyright © 2026 · Tron Weekly. All Rights Reserved. NOTE: Tron Weekly is an independent crypto news site that adheres to the strict journalism policy anchored on transparency, trust, and objectivity, we have no affiliation with the TRON Foundation, its founder Justin Sun or any other cryptocurrency firm.