Ethereum traded near $2,063 on March 31, 2026, as strong resistance and liquidity capped upward movement. This structure is increasing the probability of a breakdown toward lower demand zones.
According to CoinMarketCap, ETH declined 0.14% over 24 hours while holding above $2,000 support. This Ethereum analysis shows that momentum continues to weaken across multiple timeframes.

Price Structure Shows Weakness
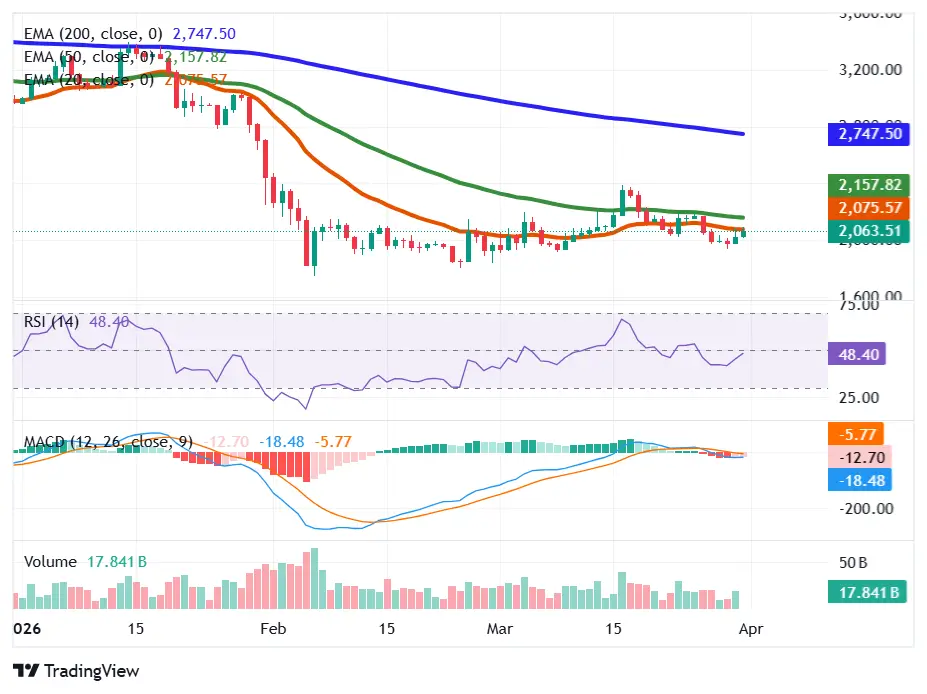
ETH’s current price is below its 50 Exponential Moving Average (EMA) and its 200 EMA as reported by TradingView charts. As such, the overall structure of ETH’s price appears to show signs of a bearish trend.
Upside attempts continue failing, increasing downside pressure. In addition, ETH’s 20 EMA is appearing as flat. A flat 20 EMA the price of the token is consolidating at this time.
It is worth noting that ETH’s price dropped substantially in late January. The current price activity for ETH is taking place between a defined resistance zone of $2,160 and a support zone of $2,021.
An RSI reading of nearly 48 shows neutral momentum, indicating no short term or long-term bullish momentum. In addition to the neutral momentum from the RSI, ETH’s MACD indicator is showing a negative sign. The negative sign from the MACD indicator suggests fading attempts at recovery.
Also Read | Ethereum (ETH) Price Eyes 10% Surge Amid Fear
Selling Pressure Indicates Rejection
Crypto Analyst @acethebulllly identified a significant amount of sell-side pressure being built in the short-term order flow. He further stated that there is a lot of sell volume in the $2,107 to $2,160 region.
He further said that there are many barriers to the coin’s upside price movement at these levels. The $2,107 to $2,160 region is continuing to act as a barrier for buyers looking to push the price higher.
Every subsequent failure for buyers to move the ETH price above this area creates a stronger potential for a bearish continuation. The support zone for the token appears to be relatively weak, given the significant amount of downward selling pressure that is building.
Decreasing Number of Participants
According to CoinGlass data, futures volume increased by 11.72% to $56.71 billion, and open interest decreased by 4.77%. Open interest suggests decreasing trader confidence. ETH/USDT long-to-short ratio on Binance is 1.62.

This ratio is slightly biased towards long positions. If this ratio were to continue rising, then it would likely confirm additional downside risk when long positions are closed.
CoinGlass also showed that the funding rate for ETH is 0.019%. As such, this rate is essentially neutral or slightly positive. Funding rates provide insight into the overall sentiment amongst traders.
Bearish Factors Continue To Build
Arab Chain, a CryptoQuant analyst, reported that the Sharpe ratio for Ethereum continues to have a negative reading. Recent data released from CryptoQuant shows that Ethereum’s 30-day return is near -0.000039, and also records very weak returns.
Additionally, the negative Sharpe Ratio reading at -0.0012 supports investor caution throughout the broader crypto market. Also, it indicates that risk-adjusted returns remain poor. Declines in speculative demand due to low returns and declining participation are supportive of a bearish continuation.

Risk Of Further Drops Continues To Grow
Continued rejections below the resistance level means that there is a growing likelihood of Ethereum dropping through the support area of $2,021. A successful breach of this area may eventually cause the price to fall to lower demand areas.
Confirmation of this type of breakdown would support the existing downtrend structure.
Why It Is Important
The repeated failure by Ethereum to trade above resistance areas has made it even more probable that its price activity will continue downward.
This article contains market analysis and price predictions. These are not guarantees. Crypto markets are volatile. Always DYOR. Not financial advice.
Also Read | Bitmine’s Big Bet on Ethereum: A $147M Purchase in One Week