- Ethereum shows price growth, but trading volume declines, indicating market uncertainty and caution.
- Analysts focus on $3,590 resistance; breaking it could drive Ethereum higher, and failing may trigger shorts.
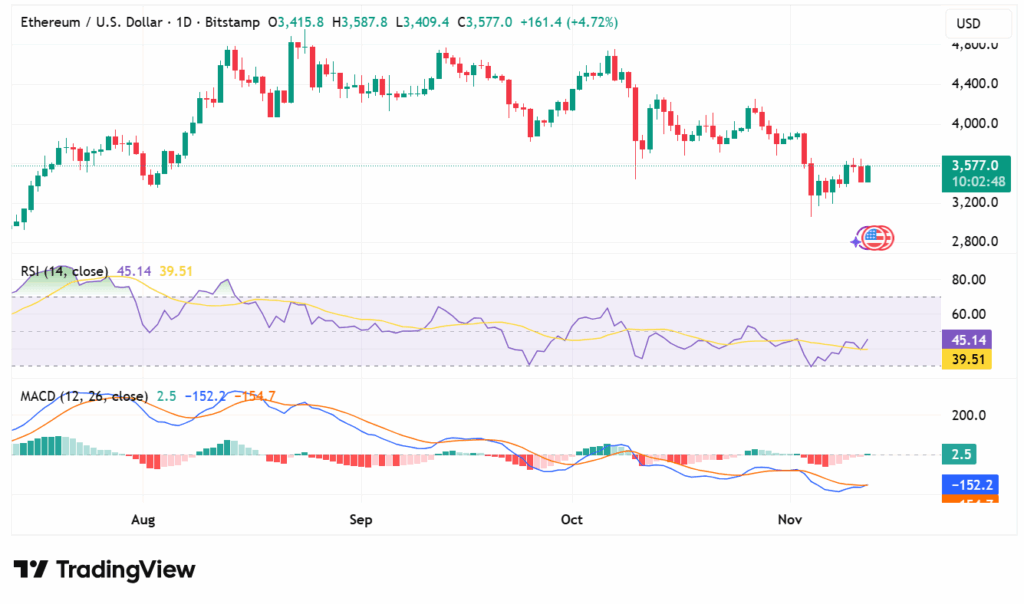
- RSI at 45.14 signals neutrality, while MACD’s negative reading hints at a bearish market trend.
Ethereum (ETH) is currently trading at $3,577, representing an increase of 4.72% in the last 24 hours. Despite this price increment, the trading volume has declined by 18.54% and is currently standing at $32.74 billion.
Over the past week, Ethereum has been increasing by 6.29%, which is an indication of a consistent growth trend. There is, however, confusion in the market due to key levels of resistance and support.

Source: CoinMarketCap
Ethereum Faces Key Resistance at $3,590
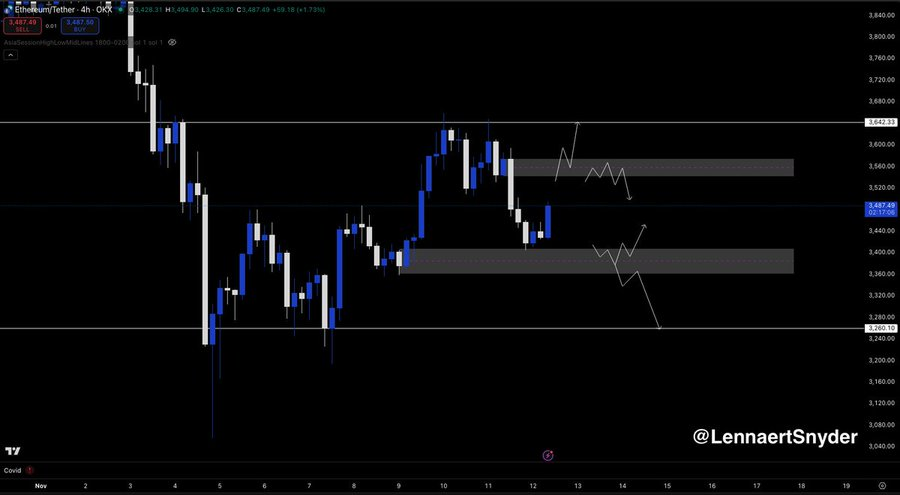
A well-known analyst, Lennaert Snyder, highlighted that the key level of resistance is 3,590. In case Ethereum breaches this level, it might set goals of a price of 3,640. However, unless it breaks above $3,590, it can initiate short positions, which can mark a possible aggressive withdrawal. The next step that Ethereum takes will depend on whether it can overcome this obstacle.
Source: X
If Bitcoin experiences price rejection, Snyder cautions that Ethereum might trail in similar fashion. This may cause a further retest of the $3,400 support zone in Bitcoin in the event of a rejection. Should this support not hold, Ethereum may see further downward bear pressure, and shorts can trigger ETH down to a bear market.
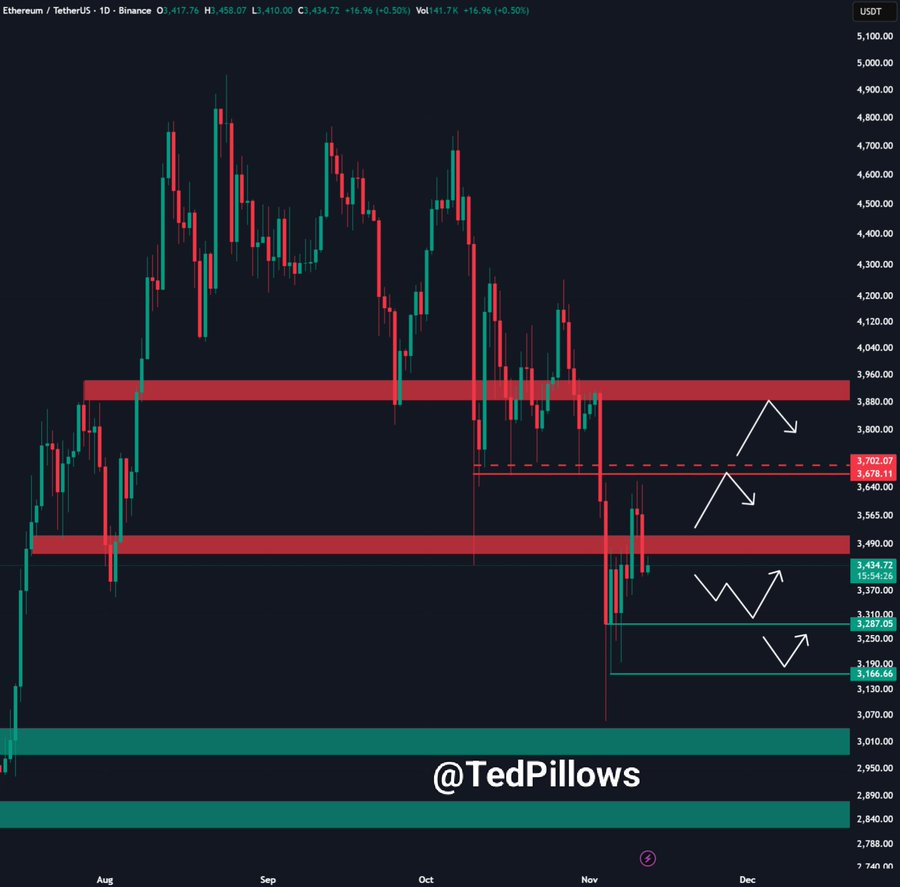
Moreover, another analyst, Ted Pillows, mentioned that Ethereum recently dropped an important support level. The next support is around $3,300. A fall under this would potentially mean that Ethereum would record a new monthly low, with this being a change to a more bearish sentiment towards the coin.
Source: X
Also Read: XRP Power Shift: 11 Days to Break Bitcoin’s Grip
Volume Decline and Open Interest Rise
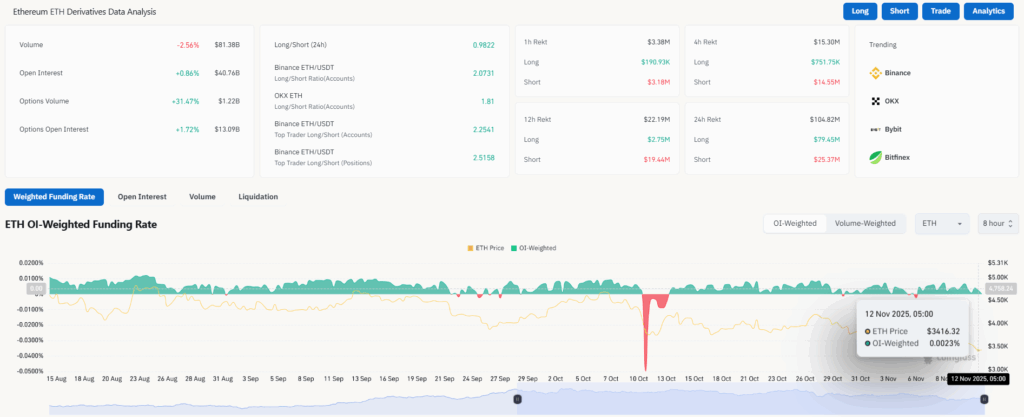
According to the CoinGlass data, the trading volume has been reduced by 2.56% to $81.38 billion. Meanwhile, the open interest is increased by 0.86% to $40.76 billion. The OI-weighted funding rate is 0.0023%, indicating a positive mood in the market. The coming days will be crucial to ETH because it will be testing major support and resistance levels.
Source: CoinGlass
RSI and MACD Show Cautious Market Outlook
The Relative Strength Index (RSI) stands at 45.14. This is a sign of neutrality or not overbought or oversold. The moving average of the RSI is 39.51, and this indicates that there exists a potential downside pressure should the momentum deteriorate.
Source: TradingView
The Moving average convergence Divergence (MACD) has a small positive figure of 2.5, indicating a marginal bullish trend. Nevertheless, the MACD histogram is still negative at -152.2, which is its indication of a continual bearish trend. This implies that Ethereum would have a narrowing conduit in the next few days unless the momentum changes.
Also Read: Binance Coin (BNB): Bulls Confident to Push It Above $960 This Month