Ethereum (ETH) fell after reaching a local high of 3,851 on July 21 down to approximately 3,658 and this setup led some people to believe that a local top has been made. As the press time, ETH has declined by almost 3.64% daily with a trading volume of $45.56 billion. The resulting price movement has increased the prospect of the short-term pullback.
Glassnode on-chain metrics are also indicating profit-taking at the cost basis of $2,520. The ETH Cost Basis Distribution Heatmap, which follows the average price used to get some ethers, looks to be seeing a decline in red, indicating that some buyers have sold it off. Nevertheless, almost 2 million ETH are still stored in those addresses; that means that people are sure of the prospects of the asset.
Rising Demand Fuels Ethereum’s Growth Potential
Glassnode shows that there is new demand that is mopping up the available supply of Ethereum. The market of Ethereum is being driven by constant purchases as big investors cash out. This will imply that there is a possibility of the asset continuing to grow upwards in case the demand continues. But other traders reckon there may be consolidation in the market because ETH is facing important lines of resistance.
The data of Santiment demonstrates the growing interest towards Ethereum from the perspective of whale investors. Although the number of Bitcoin whale addresses with more than 1,000 BTC dropped by 39 this week, the Bitcoin whale addresses with more than 10,000 ETH had increased by 45. This indicates the switch of mood, where Ethereum proves to be a strong choice of big caps in this bull run.

Source: Santiment
According to Lookonchain data, fresh wallets are still amassing Ethereum. FalconX sent 25,213 ETH (approximately 94.67 million dollars) to one of such wallets, 0x8eEa, on July 22. In three days, this wallet has incurred total 72,333 ETH. These buy-ins show high institutional demand for ETH despite the current volatility in the market.
Ethereum spot ETFs have also taken in large amounts, inflowing more than 588,000 ETH in the past week. This is almost 17 times the historical average and higher than the old record far more than that. The interest of institutions in ETH is also apparent to be gaining, further increasing its demand and forcing prices to move.
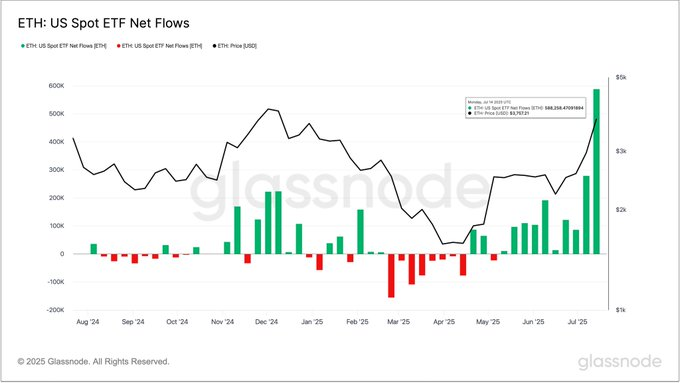
Source: Glassnode
Ethereum Bulls Eye $4,000
The bullish trend of ETH is evident in its chart, as the price rose to $3,850 after attempting to stabilise at the $2,430 level. One aspect is that the price is presently higher than the major moving averages, for instance, the 50-day, 100-day, and 200-day averages, implying a good uptrend. The 50-day moving average (green line) is still ticking up and is thus bullish.
Also Read: Ethereum Rally Gains Momentum: $10,000 Target if $4,000 Breaks
The Moving Average Convergence Divergence (MACD) indicator also gives strength. The MACD line (blue) crosses above the signal line (orange), and the histogram (green) indicates. This indicates that things are gathering steam, and a trend in the rise of prices might continue as long as the market conditions prevail.
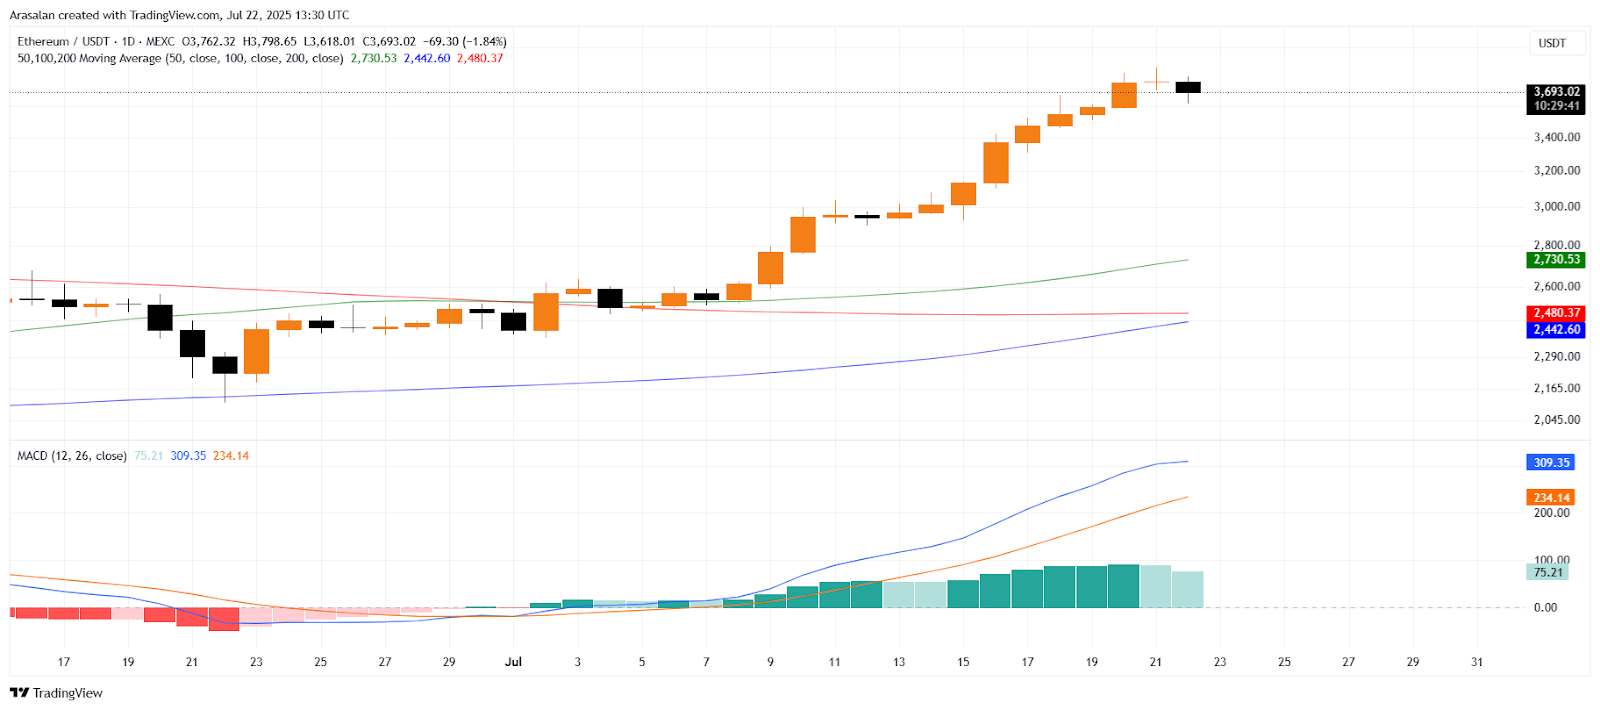
Source: TradingView
Nevertheless, ETH experiences some resistance at the cost of $3,700. In recent times, the price has consolidated around this threshold, and traders are keenly waiting to see whether the price can break beyond this. In case Ethereum succeeds in breaking this resistance, the price may rise to about 4,000, and this would pave the way for further price increases.
Although the price of Ethereum has experienced a recent pullback, high demand and increased institutional interest indicate that the cryptocurrency remains in a strong position. The ongoing accumulation of large investors and other technical indicators are a sign that Ethereum can expect to climb even higher in the immediate future.
Also Read: Bitcoin Near $120,000 Resistance: Will It Break Through or Face a Pullback?